Isuzu 2011 Annual Report Download - page 4
Download and view the complete annual report
Please find page 4 of the 2011 Isuzu annual report below. You can navigate through the pages in the report by either clicking on the pages listed below, or by using the keyword search tool below to find specific information within the annual report.
2
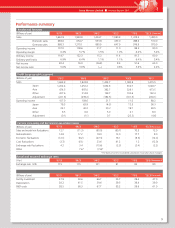
Net Sales
(Millions of yen)
Net Income (Loss)
(Millions of yen)
Total Assets
(Millions of yen)
Yen
FY
0
500,000
Mar/07 08 09 10 11
1,000,000
1,500,000
2,000,000
FY Mar/07 08 09 10 11
-30,000
0
30,000
60,000
90,000
0
500,000
1,000,000
1,500,000
Mar/07 08 09 10 11FY
U.S. dollars
Year ended March 31 2011 2010 2009 2011
For the Year:
Net sales
Net income (loss)
At Year-End:
Total assets
Net assets
$ 17,023,991
620,554
$ 13,378,948
4,654,943
¥ 1,424,708
(26,858)
¥ 1,026,786
331,773
¥ 1,080,928
8,401
¥ 1,110,383
354,534
¥ 1,415,544
51,599
¥ 1,112,459
387,058
Note: U.S. dollar figures have been calculated at the rate of ¥83.15=U.S.$1, the approximate rate of exchange prevailing on the Foreign Exchange Market on
March 31, 2011.
Millions of yen
Thousands of
U.S. dollars
$ 0.36
¥ (15.85) ¥ 4.96
¥ 30.45
Consolidated Financial Highlights
Consolidated Financial Highlights
2011 2010 2009 2011
Per Share:
Net income (loss) – primary


