Isuzu 2011 Annual Report Download - page 18
Download and view the complete annual report
Please find page 18 of the 2011 Isuzu annual report below. You can navigate through the pages in the report by either clicking on the pages listed below, or by using the keyword search tool below to find specific information within the annual report.-
 1
1 -
2
-
3
-
4
-
5
-
6
-
7
-
 8
8 -
 9
9 -
 10
10 -
 11
11 -
 12
12 -
 13
13 -
 14
14 -
 15
15 -
 16
16 -
 17
17 -
 18
18 -
 19
19 -
 20
20 -
 21
21 -
 22
22 -
 23
23 -
 24
24 -
 25
25 -
 26
26 -
 27
27 -
 28
28 -
29
-
30
-
31
-
32
-
33
-
34
-
35
-
36
-
37
-
38
 |
 |

Financial Section
16
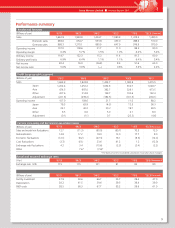
Consolidated Five-Year Summary
2011 2010 2009 2008 2007 2011
For the Year:
Net sales
Cost of sales
Gross profit
Selling, general and administrative expenses
Operating income
Income before extraordinary items
Income before income taxes
Net income (loss)
At Year-End:
Total assets
Net assets
¥ 1,662,925
1,413,402
249,523
142,542
106,980
114,697
107,483
92,394
¥ 1,232,181
389,061
¥ 1,924,833
1,666,656
258,176
148,603
109,573
122,322
110,604
76,021
¥ 1,245,947
415,278
¥ 1,424,708
1,271,067
153,640
131,989
21,651
15,236
11,475
(26,858)
¥ 1,026,786
331,773
¥ 1,080,928
962,056
118,872
107,862
11,010
11,393
9,139
8,401
¥ 1,110,383
354,534
$ 17,023,991
14,600,073
2,423,918
1,362,943
1,060,974
1,097,516
922,430
620,554
$ 13,378,948
4,654,943
¥1,415,544
1,213,996
201,548
113,328
88,220
91,258
76,700
51,599
¥ 1,112,459
387,058
2011 2010 2009 2008 2007 2011
For the Year:
Net sales
Cost of sales
Gross profit
Selling, general and administrative expenses
Operating income (loss)
Income (loss) before extraordinary items
Income (loss) before income taxes
Net income (loss)
At Year-End:
Total assets
Net assets
$ 10,469,942
8,935,081
1,534,860
964,538
570,321
664,564
528,411
469,472
$ 9,392,683
3,315,481
¥ 973,884
813,229
160,654
99,163
61,491
68,273
69,111
68,325
¥ 899,783
292,807
¥ 1,027,349
879,123
148,225
100,035
48,190
50,168
46,856
43,504
¥ 886,390
284,177
¥ 857,439
777,810
79,628
93,670
(14,041)
(3,268)
(11,617)
(35,220)
¥ 761,263
229,287
¥ 649,533
570,685
78,847
72,658
6,188
5,151
3,221
14,250
¥ 811,200
245,296
¥ 870,575
742,952
127,623
80,201
47,422
55,258
43,937
39,036
¥ 781,001
275,682
Note: U.S. dollar amounts are translated from yen, for convenience only, at the rate of ¥83.15 = US$1; the approximate exchange rate prevailing on the
Foreign Exchange Market on March 31, 2011.
Millions of yen
Thousands of
U.S. dollars
Millions of yen
Thousands of
U.S. dollars
Non-Consolidated Five-Year Summary