Intel 2012 Annual Report Download - page 59
Download and view the complete annual report
Please find page 59 of the 2012 Intel annual report below. You can navigate through the pages in the report by either clicking on the pages listed below, or by using the keyword search tool below to find specific information within the annual report.-
 1
1 -
2
-
3
-
4
-
5
-
6
-
7
-
8
-
9
-
10
-
11
-
12
-
13
-
14
-
15
-
16
-
17
-
18
-
19
-
20
-
21
-
22
-
23
-
24
-
25
-
26
-
27
-
28
-
29
-
30
-
31
-
32
-
33
-
34
-
35
-
36
-
37
-
38
-
39
-
40
-
41
-
42
-
43
-
44
-
45
-
46
-
47
-
48
-
 49
49 -
 50
50 -
 51
51 -
 52
52 -
 53
53 -
 54
54 -
 55
55 -
 56
56 -
 57
57 -
 58
58 -
 59
59 -
 60
60 -
 61
61 -
 62
62 -
 63
63 -
 64
64 -
 65
65 -
 66
66 -
 67
67 -
 68
68 -
 69
69 -
70
-
71
-
72
-
73
-
74
-
75
-
76
-
77
-
78
-
79
-
80
-
81
-
82
-
83
-
84
-
85
-
86
-
87
-
88
-
89
-
90
-
91
-
92
-
93
-
94
-
95
-
96
-
97
-
98
-
99
-
100
-
101
-
102
-
103
-
104
-
105
-
106
-
107
-
108
-
109
-
110
-
111
-
112
-
113
-
114
-
115
-
116
-
117
-
118
-
119
-
120
-
121
-
122
-
123
-
124
-
125
-
126
 |
 |

53
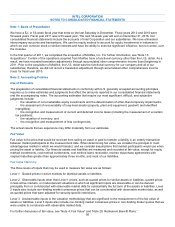
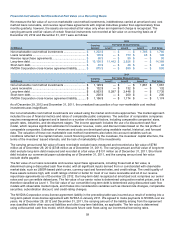
If a cash flow hedge is discontinued because it is no longer probable that the original hedged transaction will occur as
previously anticipated, the cumulative unrealized gain or loss on the related derivative is reclassified from accumulated
other comprehensive income (loss) into earnings. Subsequent gains or losses on the related derivative instrument are
recognized in interest and other, net in each period until the instrument matures, is terminated, is re-designated as a
qualified cash flow hedge, or is sold. Ineffective portions of cash flow hedges, as well as amounts excluded from the
assessment of effectiveness, are recognized in earnings in interest and other, net. For further discussion of our derivative
instruments and risk management programs, see “Note 7: Derivative Financial Instruments.”
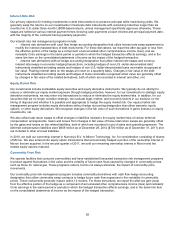
Securities Lending
We may enter into securities lending agreements with financial institutions, generally to facilitate hedging and certain
investment transactions. Selected securities may be loaned, secured by collateral in the form of cash or securities. The
loaned securities continue to be carried as investment assets on our consolidated balance sheets. For lending
agreements collateralized by cash and cash equivalents, collateral is recorded as an asset with a corresponding liability.
For lending agreements collateralized by other securities, we do not record the collateral as an asset or a liability, unless
the collateral is repledged.
Loans Receivable
We make loans to third parties that are classified within other current assets or other long-term assets. We may elect the
fair value option for loans when the interest rate or foreign currency exchange rate risk is economically hedged at
inception with a related derivative instrument. We record the gains or losses on these loans arising from changes in fair
value due to interest rate, currency, and counterparty credit changes, largely offset by losses or gains on the related
derivative instruments, in interest and other, net. Loans that are denominated in U.S. dollars and have a floating-rate
coupon are carried at amortized cost. We measure interest income for all loans receivable using the interest method,
which is based on the effective yield of the loans rather than the stated coupon rate. For further discussion of our loans
receivable, see “Note 4: Fair Value.”
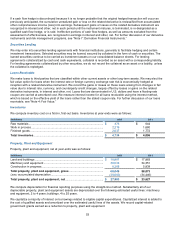
Inventories
We compute inventory cost on a first-in, first-out basis. Inventories at year-ends were as follows:
(In Millions)
2012
2011
Raw materials................................................................................................
$ 478
$ 644
Work in process................................................................................................
2,219
1,680
Finished goods ................................................................................................
2,037
1,772
Total inventories...............................................................................................
$ 4,734
$ 4,096
Property, Plant and Equipment
Property, plant and equipment, net at year-ends was as follows:
(In Millions)
2012
2011
Land and buildings ...............................................................................................
$ 18,807
$ 17,883
Machinery and equipment ....................................................................................
39,033
34,351
Construction in progress.......................................................................................
8,206
5,839
Total property, plant and equipment, gross ....................................................
66,046
58,073
Less: accumulated depreciation ...........................................................................
(38,063)
(34,446)
Total property, plant and equipment, net.........................................................
$ 27,983
$ 23,627
We compute depreciation for financial reporting purposes using the straight-line method. Substantially all of our
depreciable property, plant and equipment assets are depreciated over the following estimated useful lives: machinery
and equipment, 2 to 4 years; buildings, 4 to 25 years.
We capitalize a majority of interest on borrowings related to eligible capital expenditures. Capitalized interest is added to
the cost of qualified assets and amortized over the estimated useful lives of the assets. We record capital-related
government grants earned as a reduction to property, plant and equipment.