Intel 2012 Annual Report Download - page 38
Download and view the complete annual report
Please find page 38 of the 2012 Intel annual report below. You can navigate through the pages in the report by either clicking on the pages listed below, or by using the keyword search tool below to find specific information within the annual report.-
 1
1 -
2
-
3
-
4
-
5
-
6
-
7
-
8
-
9
-
10
-
11
-
12
-
13
-
14
-
15
-
16
-
17
-
18
-
19
-
20
-
21
-
22
-
23
-
24
-
25
-
26
-
27
-
 28
28 -
 29
29 -
 30
30 -
 31
31 -
 32
32 -
 33
33 -
 34
34 -
 35
35 -
 36
36 -
 37
37 -
 38
38 -
 39
39 -
 40
40 -
 41
41 -
 42
42 -
 43
43 -
 44
44 -
 45
45 -
 46
46 -
 47
47 -
 48
48 -
49
-
50
-
51
-
52
-
53
-
54
-
55
-
56
-
57
-
58
-
59
-
60
-
61
-
62
-
63
-
64
-
65
-
66
-
67
-
68
-
69
-
70
-
71
-
72
-
73
-
74
-
75
-
76
-
77
-
78
-
79
-
80
-
81
-
82
-
83
-
84
-
85
-
86
-
87
-
88
-
89
-
90
-
91
-
92
-
93
-
94
-
95
-
96
-
97
-
98
-
99
-
100
-
101
-
102
-
103
-
104
-
105
-
106
-
107
-
108
-
109
-
110
-
111
-
112
-
113
-
114
-
115
-
116
-
117
-
118
-
119
-
120
-
121
-
122
-
123
-
124
-
125
-
126
 |
 |

32
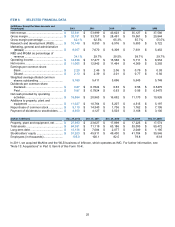
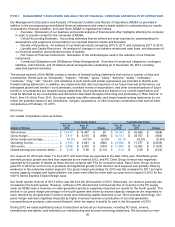
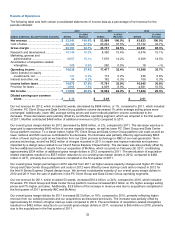
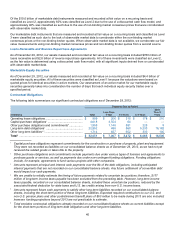
Results of Operations
The following table sets forth certain consolidated statements of income data as a percentage of net revenue for the
periods indicated:
2012
2011
2010
(Dollars in Millions, Except Per Share Amounts)
Dollars
% of Net
Revenue
Dollars
% of Net
Revenue
Dollars
% of Net
Revenue
Net revenue................................................
$ 53,341
100.0%
$ 53,999
100.0%
$ 43,623
100.0%
Cost of sales................................................
20,190
37.9%
20,242
37.5%
15,132
34.7%
Gross margin .............................................
33,151
62.1%
33,757
62.5%
28,491
65.3%
Research and development.........................
10,148
19.0%
8,350
15.4%
6,576
15.1%
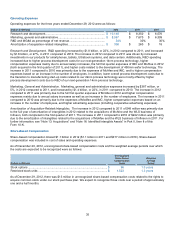
Marketing, general and
administrative ..........................................
8,057
15.1%
7,670
14.2%
6,309
14.5%
Amortization of acquisition-related
intangibles ...............................................
308
0.6%
260
0.5%
18
—%
Operating income ......................................
14,638
27.4%
17,477
32.4%
15,588
35.7%
Gains (losses) on equity
investments, net ......................................
141
0.3%
112
0.2%
348
0.8%
Interest and other, net ................................
94
0.2%
192
0.3%
109
0.3%
Income before taxes................................
14,873
27.9%
17,781
32.9%
16,045
36.8%
Provision for taxes.......................................
3,868
7.3%
4,839
8.9%
4,581
10.5%
Net income .................................................
$ 11,005
20.6%
$ 12,942
24.0%
$ 11,464
26.3%
Diluted earnings per common
share.......................................................
$ 2.13
$ 2.39
$ 2.01
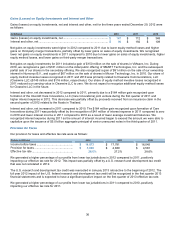
Our net revenue for 2012, which included 52 weeks, decreased by $658 million, or 1%, compared to 2011, which included
53 weeks. PC Client Group and Data Center Group platform volume decreased 1% while average selling prices were
unchanged. Additionally, lower IMC average selling prices and lower netbook platform volume contributed to the
decrease. These decreases were partially offset by our McAfee operating segment, which we acquired in the first quarter
of 2011. McAfee contributed $469 million of additional revenue in 2012 compared to 2011.
Our overall gross margin dollars for 2012 decreased by $606 million, or 2%, compared to 2011. The decrease was due in
large part to approximately $490 million of excess capacity charges, as well as lower PC Client Group and Data Center
Group platform revenue. To a lesser extent, higher PC Client Group and Data Center Group platform unit costs as well as
lower netbook and IMC revenue contributed to the decrease. The decrease was partially offset by approximately $645
million of lower start-up costs as we transition from our 22nm process technology to R&D of our next-generation 14nm
process technology, as well as $422 million of charges recorded in 2011 to repair and replace materials and systems
impacted by a design issue related to our Intel 6 Series Express Chipset family. The decrease was also partially offset by
the two additional months of results from our acquisition of McAfee, which occurred on February 28, 2011, contributing
approximately $334 million of additional gross margin dollars in 2012 compared to 2011. The amortization of acquisition-
related intangibles resulted in a $557 million reduction to our overall gross margin dollars in 2012, compared to $482
million in 2011, primarily due to acquisitions completed in the first quarter of 2011.
Our overall gross margin percentage in 2012 was flat from 2011 as higher excess capacity charges and higher PC Client
Group and Data Center Group platform unit costs in 2012 were offset by lower start-up costs and no impact in 2012 for
the Intel 6 Series Express Chipset design issue. We derived a substantial majority of our overall gross margin dollars in
2012 and 2011 from the sale of platforms in the PC Client Group and Data Center Group operating segments.
Our net revenue for 2011, which included 53 weeks, increased $10.4 billion, or 24%, compared to 2010, which included
52 weeks. PC Client Group and Data Center Group platform revenue increased $6.3 billion on 8% higher average selling
prices and 7% higher unit sales. Additionally, $3.6 billion of the increase in revenue was due to acquisitions completed in
the first quarter of 2011 (primarily IMC and McAfee).
Our overall gross margin dollars for 2011 increased $5.3 billion, or 18%, compared to 2010, primarily reflecting higher
revenue from our existing business and our acquisitions as discussed previously. The increase was partially offset by
approximately $1.0 billion of higher start-up costs compared to 2010. The amortization of acquisition-related intangibles
resulted in a $482 million reduction to our overall gross margin dollars in 2011, compared to $65 million in 2010, primarily
due to the acquisitions in the first quarter of 2011.