Intel 2012 Annual Report Download - page 54
Download and view the complete annual report
Please find page 54 of the 2012 Intel annual report below. You can navigate through the pages in the report by either clicking on the pages listed below, or by using the keyword search tool below to find specific information within the annual report.-
 1
1 -
2
-
3
-
4
-
5
-
6
-
7
-
8
-
9
-
10
-
11
-
12
-
13
-
14
-
15
-
16
-
17
-
18
-
19
-
20
-
21
-
22
-
23
-
24
-
25
-
26
-
27
-
28
-
29
-
30
-
31
-
32
-
33
-
34
-
35
-
36
-
37
-
38
-
39
-
40
-
41
-
42
-
43
-
 44
44 -
 45
45 -
 46
46 -
 47
47 -
 48
48 -
 49
49 -
 50
50 -
 51
51 -
 52
52 -
 53
53 -
 54
54 -
 55
55 -
 56
56 -
 57
57 -
 58
58 -
 59
59 -
 60
60 -
 61
61 -
 62
62 -
 63
63 -
 64
64 -
65
-
66
-
67
-
68
-
69
-
70
-
71
-
72
-
73
-
74
-
75
-
76
-
77
-
78
-
79
-
80
-
81
-
82
-
83
-
84
-
85
-
86
-
87
-
88
-
89
-
90
-
91
-
92
-
93
-
94
-
95
-
96
-
97
-
98
-
99
-
100
-
101
-
102
-
103
-
104
-
105
-
106
-
107
-
108
-
109
-
110
-
111
-
112
-
113
-
114
-
115
-
116
-
117
-
118
-
119
-
120
-
121
-
122
-
123
-
124
-
125
-
126
 |
 |

48
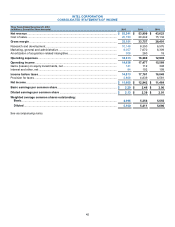
INTEL CORPORATION
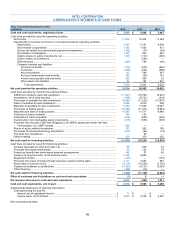
CONSOLIDATED STATEMENTS OF CASH FLOWS
Three Years Ended December 29, 2012
(In Millions)
2012
2011
2010
Cash and cash equivalents, beginning of year .....................................................................................
$ 5,065
$ 5,498
$ 3,987
Cash flows provided by (used for) operating activities:
Net income............................................................................................................................................
11,005
12,942
11,464
Adjustments to reconcile net income to net cash provided by operating activities:
Depreciation................................................................................................................................
6,357
5,141
4,398
Share-based compensation.............................................................................................................
1,102
1,053
917
Excess tax benefit from share-based payment arrangements.........................................................
(142)
(37)
(65)
Amortization of intangibles...............................................................................................................
1,165
923
240
(Gains) losses on equity investments, net .......................................................................................
(141)
(112)
(348)
(Gains) losses on divestitures..........................................................................................................
—
(164)
—
Deferred taxes ................................................................................................................................
(242)
790
(46)
Changes in assets and liabilities:
Accounts receivable....................................................................................................................
(176)
(678)
(584)
Inventories ................................................................................................................................
(626)
(243)
(806)
Accounts payable .......................................................................................................................
67
596
407
Accrued compensation and benefits...........................................................................................
192
(95)
161
Income taxes payable and receivable ........................................................................................
229
660
53
Other assets and liabilities..........................................................................................................
94
187
901
Total adjustments ..................................................................................................................
7,879
8,021
5,228
Net cash provided by operating activities .............................................................................................
18,884
20,963
16,692
Cash flows provided by (used for) investing activities:
Additions to property, plant and equipment ..........................................................................................
(11,027)
(10,764)
(5,207)
Acquisitions, net of cash acquired ........................................................................................................
(638)
(8,721)
(218)
Purchases of available-for-sale investments ........................................................................................
(8,694)
(11,230)
(17,675)
Sales of available-for-sale investments ................................................................................................
2,282
9,076
506
Maturities of available-for-sale investments..........................................................................................
5,369
11,029
12,627
Purchases of trading assets..................................................................................................................
(16,892)
(11,314)
(8,944)
Maturities and sales of trading assets................................................................................................
15,786
11,771
8,846
Collection of loans receivable ...............................................................................................................
149
134
—
Origination of loans receivable..............................................................................................................
(216)
(206)
(498)
Investments in non-marketable equity investments ..............................................................................
(475)
(693)
(393)
Proceeds from the sale of IM Flash Singapore, LLP (IMFS) assets and certain IM Flash
Technologies, LLC (IMFT) assets................................................................................................
605
—
—
Return of equity method investments ................................................................................................
137
263
199
Purchases of licensed technology and patents.....................................................................................
(815)
(66)
(14)
Proceeds from divestitures ...................................................................................................................
—
50
—
Other investing................................................................................................................................
369
370
232
Net cash used for investing activities................................................................................................
(14,060)
(10,301)
(10,539)
Cash flows provided by (used for) financing activities:
Increase (decrease) in short-term debt, net..........................................................................................
65
209
23
Proceeds from government grants........................................................................................................
63
124
79
Excess tax benefit from share-based payment arrangements..............................................................
142
37
65
Issuance of long-term debt, net of issuance costs................................................................................
6,124
4,962
—
Repayment of debt................................................................................................................................
(125)
—
(157)
Proceeds from sales of shares through employee equity incentive plans ............................................
2,111
2,045
587
Repurchase of common stock ..............................................................................................................
(5,110)
(14,340)
(1,736)
Payment of dividends to stockholders ................................................................................................
(4,350)
(4,127)
(3,503)
Other financing................................................................................................................................
(328)
(10)
—
Net cash used for financing activities................................................................................................
(1,408)
(11,100)
(4,642)
Effect of exchange rate fluctuations on cash and cash equivalents ..................................................
(3)
5
—
Net increase (decrease) in cash and cash equivalents........................................................................
3,413
(433)
1,511
Cash and cash equivalents, end of year................................................................................................
$ 8,478
$ 5,065
$ 5,498
Supplemental disclosures of cash flow information:
Cash paid during the year for:
Interest, net of capitalized interest ................................................................................................
$ 71
$ —
$ —
Income taxes, net of refunds............................................................................................................
$ 3,930
$ 3,338
$ 4,627
See accompanying notes.