Ingram Micro 2011 Annual Report Download - page 3
Download and view the complete annual report
Please find page 3 of the 2011 Ingram Micro annual report below. You can navigate through the pages in the report by either clicking on the pages listed below, or by using the keyword search tool below to find specific information within the annual report.
DEAR FELLOW SHAREHOLDERS,
OUR BUSINESS IN 2011 WAS A REFLECTION OF THE DIVERSITY OF OUR ACTIVITIES AND GEOGRAPHIC
REACH. OUTSTANDING PERFORMANCE FROM MANY OPERATIONS COMPLEMENTED OTHER
BUSINESSES THAT MADE MORE MUTED CONTRIBUTIONS TO THE OVERALL COMPANY MOSAIC.
YET, AS WITH ANY MOSAIC, A BROADER PERSPECTIVE REVEALS THE FULL PICTURE. THE UNIQUE
CONTRIBUTION FROM EVERY PART OF OUR COMPANY UNITES US AS A GLOBAL ORGANIZATION,
BONDED FOR LONG-TERM SUCCESS. OUR DIVERSITY CREATES STRENGTH, VITALITY AND STABILITY.
INGRAM MICRO SERVES ONE WORLD AND THE MOSAIC WE HAVE CREATED WILL HELP ENSURE THAT
WE DO SO AS ONE COMPANY.
THE FINANCIALS: SECURING THE MOSAIC
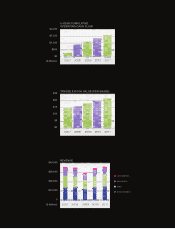
Revenues for 2011 hit a historic high, reaching $36.3 billion despite economic and other unique
challenges in certain areas of our operations. The year-over-year growth of 5 percent was driven primarily
by strength in North and Latin America and the emerging countries of Asia, where the need for greater
workplace productivity, as well as the introduction of new vendors and products, spurred demand.
Operating income was a healthy $459 million, despite economic softness in Europe and the disruptions
caused by our transition to a new enterprise system in Australia. Outside Australia, our aggregate
operating income for the rest of the world surpassed the prior-year levels at a rate greater than our growth
in sales, illustrating further progress in leveraging our infrastructure. Net income was $244 million, or
$1.53 per diluted share, including charges of $29 million, or $0.18 per share, related to our deferred taxes
in Brazil and the settlement of our term debt.


