Ingram Micro 2010 Annual Report Download - page 3
Download and view the complete annual report
Please find page 3 of the 2010 Ingram Micro annual report below. You can navigate through the pages in the report by either clicking on the pages listed below, or by using the keyword search tool below to find specific information within the annual report.
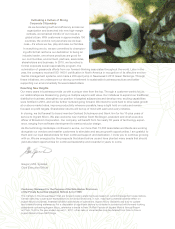
For more than 30 years Ingram Micro has stood the test of time, building an ecosystem of
valued resellers and manufacturers to become the world’s largest wholesale technology
distributor and supply-chain services provider. In 2010, we found fertile ground in new ideas
and solutions, a deeper engagement with our customers and business partners, and a fortified
position to tackle new opportunities. Our operations flourished and we grew at a double-digit
pace. As we close one of the strongest years of our history, we remain committed to helping our
customers grow with us.
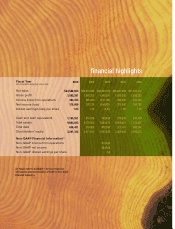
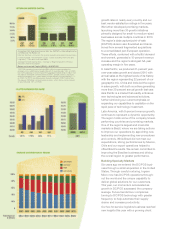
Sales grew faster in 2010 than at any time in the last 10 years, rising 17 percent to a near-record $34.6 billion,
as demand for technology products and services improved and we proactively cultivated growth throughout
the globe. These growth initiatives, combined with the cost optimization efforts completed during the prior
year, drove an operating income improvement of more than 60 percent, as reported in accordance with gener-
ally accepted accounting principles (GAAP), compared with the prior year, along with record net income and
diluted earnings per share of $318 million and $1.94, respectively.
Our balance sheet is solid, closing the year with more than $1 billion in cash. We completed a successful
$300 million public offering of senior unsecured notes in August, garnering a favorable interest rate and
providing greater exibility for our capital needs in the future. Return on invested capital (ROIC) has remained
above our weighted average cost of capital (WACC) for six consecutive quarters. For the full year, ROIC*
was 13.6 percent, more than 400 basis points above our WACC. We also demonstrated our commitment
to increasing shareholder value through the repurchase of nearly nine million shares, or $152 million, of our
common stock in 2010 and the authorization of a new three-year $400 million share repurchase plan late in
the year. Our many nancial achievements provide a strong foundation from which new initiatives will take
root and thrive.
Rooted in Distribution
What started as a simple technology distribution business has grown into something much bigger. Firmly
grounded in the fundamentals of getting the right product to the right place at the right time, we’re now
branching out. As we optimize our traditional distribution operation by implementing measures designed to
accelerate business development and improve productivity, we’re also strengthening higher-margin specialty
areas and developing budding opportunities that should provide new sources of protable revenue.
These initiatives helped make North America a key contributor to our worldwide success, yielding operat-
ing income improvement of more than 115 percent, on a GAAP basis, on 18-percent revenue growth in
2010. Much of our success can be attributed to a renewed focus on our customers, which also beneted
our vendor partners. Through the year we expanded our line card, winning several new master and exclu-
sive distributor agreements. We also created two new advanced technology divisions designed to deliver
greater specialization for our channel partners pursuing opportunities in data-center solutions.
The Europe, Middle East and Africa (EMEA) region was a true turnaround story this year, marked by higher
vendor engagement and an increased emphasis on customer service that helped drive double-digit sales
dear fellow
shareholders:
* The calculation of annual ROIC is consistent with the return on invested capital exhibit found on the following
page, where average invested capital is equal to the average of each of the last five quarters of invested capital
ending on January 1, 2011.


