Incredimail 2011 Annual Report Download - page 7
Download and view the complete annual report
Please find page 7 of the 2011 Incredimail annual report below. You can navigate through the pages in the report by either clicking on the pages listed below, or by using the keyword search tool below to find specific information within the annual report.-
 1
1 -
 2
2 -
 3
3 -
 4
4 -
 5
5 -
 6
6 -
 7
7 -
 8
8 -
 9
9 -
 10
10 -
 11
11 -
 12
12 -
 13
13 -
 14
14 -
 15
15 -
 16
16 -
 17
17 -
 18
18 -
19
-
20
-
21
-
22
-
23
-
24
-
25
-
26
-
27
-
28
-
29
-
30
-
31
-
32
-
33
-
34
-
35
-
36
-
37
-
38
-
39
-
40
-
41
-
42
-
43
-
44
-
45
-
46
-
47
-
48
-
49
-
50
-
51
-
52
-
53
-
54
-
55
-
56
-
57
-
58
-
59
-
60
-
61
-
62
-
63
-
64
-
65
-
66
-
67
-
68
-
69
-
70
-
71
-
72
-
73
-
74
-
75
-
76
-
77
-
78
-
79
-
80
-
81
-
82
-
83
-
84
-
85
-
86
-
87
-
88
-
89
-
90
-
91
-
92
-
93
-
94
-
95
-
96
-
97
-
98
-
99
-
100
-
101
-
102
-
103
-
104
-
105
-
106
-
107
-
108
-
109
-
110
-
111
-
112
-
113
-
114
-
115
-
116
-
117
-
118
-
119
-
120
-
121
-
122
-
123
-
124
-
125
-
126
-
127
-
128
-
129
-
130
-
131
-
132
-
133
-
134
-
135
-
136
-
137
-
138
-
139
-
140
-
141
-
142
-
143
-
144
-
145
-
146
-
147
-
148
-
149
-
150
-
151
-
152
-
153
-
154
-
155
-
156
-
157
-
158
-
159
-
160
-
161
-
162
-
163
-
164
-
165
-
166
-
167
-
168
-
169
-
170
-
171
-
172
-
173
-
174
-
175
-
176
-
177
-
178
-
179
-
180
-
181
-
182
-
183
-
184
-
185
-
186
-
187
-
188
-
189
-
190
-
191
-
192
-
193
-
194
-
195
-
196
-
197
-
198
-
199
-
200
-
201
-
202
-
203
-
204
-
205
-
206
-
207
-
208
-
209
-
210
-
211
-
212
-
213
-
214
-
215
-
216
-
217
-
218
-
219
-
220
-
221
-
222
-
223
-
224
-
225
-
226
-
227
-
228
-
229
-
230
-
231
-
232
-
233
 |
 |

PART I
ITEM 1. IDENTITY OF DIRE CT ORS, SENIOR MANAGEMENT AND ADVISERS
Not applicable.
ITEM 2. OFFER STATISTICS AND EXPECTED TIMETABLE
Not applicable.
ITEM 3. KEY INF ORMATION
A. SELECTED FINANCIAL DATA
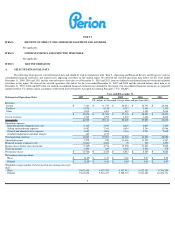
The following tables present selected financial data and should be read in conjunction with "Item 5 -
Operating and Financial Review and Prospects" and our
consolidated financial statements and related notes appearing elsewhere in this annual report. We derived the selected operations data below for the years ended
December 31, 2009, 2010 and 2011 and the selected balance sheet data as of December 31, 2010 and 2011 from our audited consolidated financial statements included
elsewhere in this report. We derived the selected operations data below for the years ended December 31, 2007 and 2008 and the selected balance sheet data as of
December 31, 2007, 2008 and 2009 from our audited consolidated financial statements not included in this report. Our consolidated financial statements are prepared
and presented in U.S. dollars and in accordance with United States Generally Accepted Accounting Principles ("U.S. GAAP").
Year ended December 31,
Statement of Operations Data:
2007
2008
2009
2010
2011
U.S. dollars in thousands (except share and per share data)
Revenues
Search
$
7,783
$
11,747
$
20,011
$
22,792
$
25,466
Products
9,078
9,158
6,717
5,404
7,191
Other
1,814
1,001
467
1,301
2,816
$
18,675
$
21,906
$
27,195
$
29,497
$
35,473
Cost of revenues
1,740
1,795
1,505
1,606
2,840
Gross profit
16,935
20,111
25,690
27,891
32,633
Operating expenses:
Research and development costs, net
6,125
7,589
6,254
6,607
7,453
Selling and marketing expenses
4,682
7,343
4,616
5,244
12,984
General and administrative expenses
3,693
3,806
3,334
4,741
7,649
Goodwill impairment and other charges
163
1,153
-
-
-
Total operating expenses
14,663
19,891
14,204
16,592
28,086
Operating income
2,272
220
11,486
11,299
4,547
Financial income (expenses), net
(3,641
)
4,494
72
322
1,293
Income (loss), before taxes on income
(1,369
)
4,714
11,558
11,621
5,840
Taxes on income
1,393
289
3,545
3,232
172
Net income (Loss)
$
(2,762
)
$
4,425
$
8,013
$
8,389
$
5,668
Net earnings (loss) per share:
Basic
$
(0.29
)
$
0.47
$
0.86
$
0.87
$
0.58
Diluted
$
(0.29
)
$
0.46
$
0.84
$
0.85
$
0.57
Weighted average number of shares used
in net earnings (loss) per
share:
Basic
9,442,658
9,427,424
9,347,915
9,622,181
9,796,380
Diluted
9,442,658
9,516,477
9,562,721
9,831,628
10,002,171
4