Huawei 2008 Annual Report Download - page 5
Download and view the complete annual report
Please find page 5 of the 2008 Huawei annual report below. You can navigate through the pages in the report by either clicking on the pages listed below, or by using the keyword search tool below to find specific information within the annual report.-
 1
1 -
 2
2 -
 3
3 -
 4
4 -
 5
5 -
 6
6 -
 7
7 -
 8
8 -
 9
9 -
 10
10 -
 11
11 -
 12
12 -
 13
13 -
 14
14 -
 15
15 -
 16
16 -
17
-
18
-
19
-
20
-
21
-
22
-
23
-
24
-
25
-
26
-
27
-
28
-
29
-
30
-
31
-
32
-
33
-
34
 |
 |

Cash Flows from Operations
(USD in millions)
100
1000
900
800
600
500
300
200
0
700
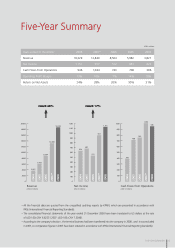
400 396
708
743
1,044
946
Revenue
(USD in millions)
2000
20000
18000
16000
14000
12000
10000
8000
6000
4000
0
18,329
3,827
5,982
8,504
12,840
CAGR:48%
Net Income
(USD in millions)
100
1200
1100
1000
900
800
600
500
300
200
0
700
400
624
681
512
957
1,151
CAGR:17%
USD in millions
Five-Year Summary
Net Income
Operating Prot Margin
Revenue
Cash Flows From Operations
Return on Net Assets
2008 2007* 2006 2005 2004
624
18%
3,827
396
31%
681
14%
5,982
708
30%
512
7%
8,504
743
20%
957
10%
12,840
1,044
28%
1,151
13%
18,329
946
24%
·All the financial data are quoted from the unqualified auditing reports by KPMG which are presented in accordance with
IFRSs (International Financial Reporting Standards).
·The consolidated nancial statements of the year ended 31 December 2008 have been translated to US dollars at the rate
of USD1.00=CNY 6.8225 ( 2007: USD1.00=CNY 7.3046).
·According to the company's decision , the terminal business had been transferred into the company in 2008 , and it was excluded
in 2007, so comparative gures in 2007 have been restated in accordance with IFRSs (International Financial Reporting Standards).
FIVE-YEAR SUMMARY 02
Years ended 31 December