Hess 2000 Annual Report Download - page 3
Download and view the complete annual report
Please find page 3 of the 2000 Hess annual report below. You can navigate through the pages in the report by either clicking on the pages listed below, or by using the keyword search tool below to find specific information within the annual report.-
 1
1 -
 2
2 -
 3
3 -
 4
4 -
 5
5 -
 6
6 -
 7
7 -
 8
8 -
 9
9 -
 10
10 -
 11
11 -
 12
12 -
 13
13 -
 14
14 -
15
-
16
-
17
-
18
-
19
-
20
-
21
-
22
-
23
-
24
-
25
-
26
-
27
-
28
-
29
-
30
-
31
-
32
-
33
-
34
-
35
-
36
-
37
-
38
-
39
-
40
-
41
-
42
-
43
-
44
-
45
-
46
-
47
-
48
-
49
-
50
-
51
-
52
-
53
-
54
-
55
-
56
-
57
-
58
-
59
-
60
-
61
-
62
 |
 |

1
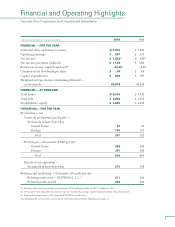
Financial and Operating Highlights
Amerada Hess Corporation and Consolidated Subsidiaries
Dollar amounts in millions, except per share data 2000 1999
FINANCIAL — FOR THE YEAR
Sales and other operating revenues $11,993 $ 7,039
Operating earnings $ 987 $ 307
Net income $ 1,023(a) $ 438(a)
Net income per share (diluted) $ 11.38 $ 4.85
Return on average capital employed(b) 20.4% 10.5%
Common stock dividends per share $ .60 $.60
Capital expenditures $ 938 $ 797
Weighted average shares outstanding (diluted)
—
in thousands 89,878 90,280
FINANCIAL —AT YEAR-END
Total assets $10,274 $ 7,728
Total debt $ 2,050 $ 2,310
Stockholders’ equity $ 3,883 $ 3,038
OPERATING —FOR THE YEAR
Production
—
net
Crude oil and natural gas liquids
—
thousands of barrels per day
United States 67 65
Foreign 194 167
Total 261 232
Natural gas
—
thousands of Mcf per day
United States 288 338
Foreign 391 305
Total 679 643
Barrels of oil equivalent
—
thousands of barrels per day 374 339
Refining and marketing
—
thousands of barrels per day
Refining crude runs
—
HOVENSA L.L.C.(c) 211 209
Refined products sold 366 344
(a) Includes after-tax income from special items of $36 million in 2000 and $131 million in 1999.
(b) Net income excluding after-tax interest expense divided by average capital employed (total debt plus equity).
(c) Reflects the Corporation’s 50% share of HOVENSA’s crude runs.
See Management’s Discussion and Analysis of Results of Operations beginning on page 19.