Hess 2000 Annual Report Download - page 21
Download and view the complete annual report
Please find page 21 of the 2000 Hess annual report below. You can navigate through the pages in the report by either clicking on the pages listed below, or by using the keyword search tool below to find specific information within the annual report.-
 1
1 -
2
-
3
-
4
-
5
-
6
-
7
-
8
-
9
-
10
-
 11
11 -
 12
12 -
 13
13 -
 14
14 -
 15
15 -
 16
16 -
 17
17 -
 18
18 -
 19
19 -
 20
20 -
 21
21 -
 22
22 -
 23
23 -
 24
24 -
 25
25 -
 26
26 -
 27
27 -
 28
28 -
 29
29 -
 30
30 -
 31
31 -
32
-
33
-
34
-
35
-
36
-
37
-
38
-
39
-
40
-
41
-
42
-
43
-
44
-
45
-
46
-
47
-
48
-
49
-
50
-
51
-
52
-
53
-
54
-
55
-
56
-
57
-
58
-
59
-
60
-
61
-
62
 |
 |

19
Management’s Discussion and Analysis of
Results of Operations and Financial Condition
Consolidated Results of Operations
Net income amounted to $1,023 million in 2000, $438 mil-
lion in 1999 and a loss of $459 million in 1998. Operating
earnings (income excluding special items) amounted to
$987 million in 2000 compared with $307 million in 1999
and a loss of $196 million in 1998.
The after-tax results by major operating activity for 2000,
1999 and 1998 are summarized below:
Millions of dollars 2000 1999 1998
Exploration and production $868 $324 $ (18)
Refining, marketing
and shipping 288 133 (18)
Corporate (43) (31) (37)
Interest (126) (119) (123)
Operating earnings (loss) 987 307 (196)
Special items 36 131 (263)
Net income (loss) $1,023 $ 438 $ (459)
Net income (loss) per
share (diluted) $11.38 $4.85 $(5.12)
Comparison of Results
Exploration and Production: Operating earnings from explo-
ration and production activities increased by $544 million
in 2000, primarily due to significantly higher worldwide
crude oil selling prices, increased United States natural
gas selling prices and higher crude oil sales volumes.
Operating earnings increased by $342 million in 1999,
largely due to higher crude oil selling prices, increased
sales volumes and reduced exploration expenses.
The Corporation’s average selling prices, including the
effects of hedging, were as follows:
2000 1999 1998
Crude oil (per barrel)
United States $23.97 $16.71 $12.56
Foreign 25.53 18.07 13.18
Natural gas liquids (per barrel)
United States 22.30 13.59 9.52
Foreign 23.41 14.29 10.42
Natural gas (per Mcf)
United States 3.74 2.14 2.08
Foreign 2.20 1.79 2.26
The Corporation’s net daily worldwide production was
as follows:
2000 1999 1998
Crude oil
(thousands of barrels per day)
United States 55 55 37
Foreign 185 159 153
Total 240 214 190
Natural gas liquids
(thousands of barrels per day)
United States 12 10 8
Foreign 988
Total 21 18 16
Natural gas
(thousands of Mcf per day)
United States 288 338 294
Foreign 391 305 282
Total 679 643 576
Barrels of oil equivalent
(thousands of barrels per day) 374 339 302
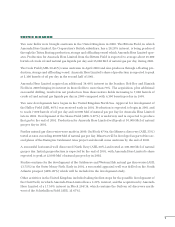
FINANCIAL REVIEW
Amerada Hess Corporation and Consolidated Subsidiaries