Hertz 2009 Annual Report Download - page 98
Download and view the complete annual report
Please find page 98 of the 2009 Hertz annual report below. You can navigate through the pages in the report by either clicking on the pages listed below, or by using the keyword search tool below to find specific information within the annual report.-
 1
1 -
2
-
3
-
4
-
5
-
6
-
7
-
8
-
9
-
10
-
11
-
12
-
13
-
14
-
15
-
16
-
17
-
18
-
19
-
20
-
21
-
22
-
23
-
24
-
25
-
26
-
27
-
28
-
29
-
30
-
31
-
32
-
33
-
34
-
35
-
36
-
37
-
38
-
39
-
40
-
41
-
42
-
43
-
44
-
45
-
46
-
47
-
48
-
49
-
50
-
51
-
52
-
53
-
54
-
55
-
56
-
57
-
58
-
59
-
60
-
61
-
62
-
63
-
64
-
65
-
66
-
67
-
68
-
69
-
70
-
71
-
72
-
73
-
74
-
75
-
76
-
77
-
78
-
79
-
80
-
81
-
82
-
83
-
84
-
85
-
86
-
87
-
 88
88 -
 89
89 -
 90
90 -
 91
91 -
 92
92 -
 93
93 -
 94
94 -
 95
95 -
 96
96 -
 97
97 -
 98
98 -
 99
99 -
 100
100 -
 101
101 -
 102
102 -
 103
103 -
 104
104 -
 105
105 -
 106
106 -
 107
107 -
 108
108 -
109
-
110
-
111
-
112
-
113
-
114
-
115
-
116
-
117
-
118
-
119
-
120
-
121
-
122
-
123
-
124
-
125
-
126
-
127
-
128
-
129
-
130
-
131
-
132
-
133
-
134
-
135
-
136
-
137
-
138
-
139
-
140
-
141
-
142
-
143
-
144
-
145
-
146
-
147
-
148
-
149
-
150
-
151
-
152
-
153
-
154
-
155
-
156
-
157
-
158
-
159
-
160
-
161
-
162
-
163
-
164
-
165
-
166
-
167
-
168
-
169
-
170
-
171
-
172
-
173
-
174
-
175
-
176
-
177
-
178
-
179
-
180
-
181
-
182
-
183
-
184
-
185
-
186
-
187
-
188
-
189
-
190
-
191
-
192
-
193
-
194
-
195
-
196
-
197
-
198
-
199
-
200
-
201
-
202
-
203
-
204
-
205
-
206
-
207
-
208
-
209
-
210
-
211
-
212
-
213
-
214
-
215
-
216
-
217
-
218
-
219
-
220
-
221
-
222
-
223
-
224
-
225
-
226
-
227
-
228
-
229
-
230
-
231
-
232
 |
 |
ITEM 7. MANAGEMENT’S DISCUSSION AND ANALYSIS OF FINANCIAL CONDITION AND
RESULTS OF OPERATIONS (Continued)
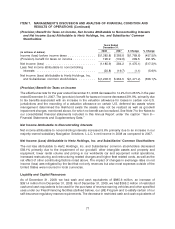
$366.2 million from December 31, 2008 to December 31, 2009, primarily related to the timing of
purchases and sales of revenue earning vehicles.
Our domestic and international operations are funded by cash provided by operating activities and by
extensive financing arrangements maintained by us in the United States, Europe, Puerto Rico, Australia,
New Zealand, Canada and Brazil. Net cash provided by operating activities during the year ended
December 31, 2009 was $1,775.0 million, a decrease of $769.2 million from the year ended
December 31, 2008. The decrease was primarily driven by a decrease in net income before
depreciation, amortization, non-cash impairment charges and other non-cash expenses as well as a
significant change in accounts payable driven by effective management of vendor terms taken in late
2008 and an increase in cash payments relating to the buydown of our rate on our interest rate swaps
and restructuring. Net cash provided by operating activities during the year ended December 31, 2008
was $2,544.2 million, a decrease of $260.5 million from the year ended December 31, 2007. The
decrease was primarily driven by a decrease in net income before depreciation, amortization, non-cash
impairment charges and other non-cash expenses.
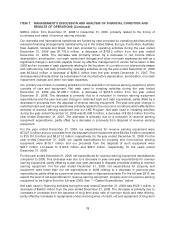
Our primary use of cash in investing activities is for the acquisition of revenue earning equipment, which
consists of cars and equipment. Net cash used in investing activities during the year ended
December 31, 2009 was $1,289.7 million, a decrease of $618.5 million from the year ended
December 31, 2008. The decrease is primarily due to a reduction in revenue earning equipment
expenditures and the year-over-year change in restricted cash and cash equivalents, partly offset by a
decrease in proceeds from the disposal of revenue earning equipment. The year-over-year change in
restricted cash and cash equivalents was primarily related to the economic conditions which affected the
demand of revenue earning equipment and our LKE Program. Net cash used in investing activities
during the year ended December 31, 2008 was $1,908.3 million, a decrease of $150.5 million from the
year ended December 31, 2007. The decrease is primarily due to a reduction in revenue earning
equipment expenditures, partly offset by a decrease in proceeds from disposal of revenue earning
equipment.
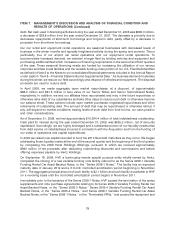
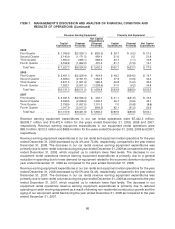
For the year ended December 31, 2009, our expenditures for revenue earning equipment were
$7,527.3 million and our proceeds from the disposal of such equipment were $6,024.9 million compared
to $10,151.0 million and $8,511.2 million, respectively, for the year ended December 31, 2008. For the
year ended December 31, 2009, our capital expenditures for property and non-revenue earning
equipment were $100.7 million and our proceeds from the disposal of such equipment were
$23.7 million compared to $193.8 million and $68.5 million, respectively, for the years ended
December 31, 2008.
For the year ended December 31, 2009, net expenditures for revenue earning equipment decreased as
compared to 2008. This decrease was due to a decrease in year-over-year expenditures for revenue
earning equipment, partly offset by a year-over-year decrease in disposal proceeds relating to revenue
earning equipment. For the year ended December 31, 2009, net expenditures for property and
equipment were lower than our net expenditures in 2008 relating to a decrease in year-over-year
expenditures, partly offset by a year-over-year decrease in disposal proceeds. For the full year 2010, we
expect the level of net expenditures for revenue earning equipment, property and non-revenue earning
equipment to be higher than the full year 2009. See ‘‘—Capital Expenditures’’ below.
Net cash used in financing activities during the year ended December 31, 2009 was $129.1 million, a
decrease of $566.3 million from the year ended December 31, 2008. The decrease is primarily due to
increases in proceeds from the issuance of long-term debt, sale of common stock and debt offering,
partly offset by increases in repayments under revolving lines of credit, net and repayment of long-term
78