Hertz 2008 Annual Report Download - page 92
Download and view the complete annual report
Please find page 92 of the 2008 Hertz annual report below. You can navigate through the pages in the report by either clicking on the pages listed below, or by using the keyword search tool below to find specific information within the annual report.-
 1
1 -
2
-
3
-
4
-
5
-
6
-
7
-
8
-
9
-
10
-
11
-
12
-
13
-
14
-
15
-
16
-
17
-
18
-
19
-
20
-
21
-
22
-
23
-
24
-
25
-
26
-
27
-
28
-
29
-
30
-
31
-
32
-
33
-
34
-
35
-
36
-
37
-
38
-
39
-
40
-
41
-
42
-
43
-
44
-
45
-
46
-
47
-
48
-
49
-
50
-
51
-
52
-
53
-
54
-
55
-
56
-
57
-
58
-
59
-
60
-
61
-
62
-
63
-
64
-
65
-
66
-
67
-
68
-
69
-
70
-
71
-
72
-
73
-
74
-
75
-
76
-
77
-
78
-
79
-
80
-
81
-
 82
82 -
 83
83 -
 84
84 -
 85
85 -
 86
86 -
 87
87 -
 88
88 -
 89
89 -
 90
90 -
 91
91 -
 92
92 -
 93
93 -
 94
94 -
 95
95 -
 96
96 -
 97
97 -
 98
98 -
 99
99 -
 100
100 -
 101
101 -
 102
102 -
103
-
104
-
105
-
106
-
107
-
108
-
109
-
110
-
111
-
112
-
113
-
114
-
115
-
116
-
117
-
118
-
119
-
120
-
121
-
122
-
123
-
124
-
125
-
126
-
127
-
128
-
129
-
130
-
131
-
132
-
133
-
134
-
135
-
136
-
137
-
138
-
139
-
140
-
141
-
142
-
143
-
144
-
145
-
146
-
147
-
148
-
149
-
150
-
151
-
152
-
153
-
154
-
155
-
156
-
157
-
158
-
159
-
160
-
161
-
162
-
163
-
164
-
165
-
166
-
167
-
168
-
169
-
170
-
171
-
172
-
173
-
174
-
175
-
176
-
177
-
178
-
179
-
180
-
181
-
182
-
183
-
184
-
185
-
186
-
187
-
188
-
189
-
190
-
191
-
192
-
193
-
194
-
195
-
196
-
197
-
198
-
199
-
200
-
201
-
202
-
203
-
204
-
205
-
206
-
207
-
208
-
209
-
210
-
211
-
212
-
213
-
214
-
215
-
216
-
217
-
218
-
219
-
220
-
221
-
222
-
223
-
224
-
225
-
226
-
227
-
228
-
229
-
230
-
231
-
232
-
233
-
234
-
235
-
236
-
237
-
238
-
239
-
240
-
241
-
242
-
243
-
244
-
245
-
246
-
247
-
248
-
249
-
250
-
251
-
252
 |
 |
ITEM 7. MANAGEMENT’S DISCUSSION AND ANALYSIS OF FINANCIAL CONDITION AND
RESULTS OF OPERATIONS (Continued)
surplus vehicles and equipment and recognition of future facility lease obligations for those locations
vacated by year-end. The locations closed were strategically selected to enable us to continue to
provide our rental services from other locations in the same area to our loyal customer base. We will
continue to assess the effectiveness, size and geographical presence of our global network footprint and
may make adjustments as warranted. In January 2009, we announced that, as part of a comprehensive
plan to further decrease costs and as a result of reduced rental demand, we were reducing our global
workforce by more than 4,000 employees beginning in the fourth quarter 2008 and continuing through
the first quarter of 2009, more than half of whom are not eligible for severance benefits. We expect job
reductions in the car and equipment rental businesses, corporate and support areas, and in all
geographies, with an emphasis on eliminating non-customer facing jobs. Related to these location
closures and continued cost reduction initiatives, we incurred restructuring charges for employee
termination liabilities covering approximately 1,500 employee separations in the fourth quarter.
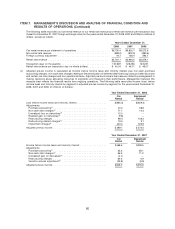
For the years ended December 31, 2008 and 2007, our consolidated statement of operations includes
restructuring charges relating to the initiatives discussed above of $216.1 million and $96.4 million,
respectively.
Additional efficiency and cost saving initiatives may be developed during 2009. However, we presently
do not have firm plans or estimates of any related expenses. See Note 12 to the Notes to our
consolidated financial statements included in this Annual Report under caption ‘‘Item 8—Financial
Statements and Supplementary Data.’’
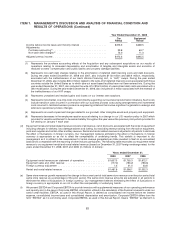
For the year ended December 31, 2008, based on publicly available information, we believe some U.S.
car rental companies experienced declines in transaction days and rental rate revenue per transaction
day, or ‘‘RPD,’’ compared to the year ended December 31, 2007. For the year ended December 31,
2008, in the United States, we experienced a 3.7% decrease in transaction days and a 2.0% decrease in
RPD versus 2007. During the year ended December 31, 2008, in our European operations, we
experienced a low to mid single digit increase in transaction days and a low to mid single digit decrease
in RPD versus 2007.
In the three years ended December 31, 2008, we increased the number of our off-airport rental locations
in the United States by approximately 20% to approximately 1,645 locations. Revenues from our U.S.
off-airport operations grew during the same period, representing $971.8 million, $963.8 million and
$890.1 million of our total car rental revenues in the years ended December 31, 2008, 2007 and 2006,
respectively. In 2009 and subsequent years, our strategy will include selected openings of new
off-airport locations, the disciplined evaluation of existing locations and the pursuit of same-store sales
growth. Our strategy includes increasing penetration in the off-airport market and growing the online
leisure market, particularly in the longer length weekly sector, which is characterized by lower vehicle
costs and lower transaction costs at a lower RPD. Increasing our penetration in these sectors is
consistent with our long-term strategy to generate profitable growth. When we open a new off-airport
location, we incur a number of costs, including those relating to site selection, lease negotiation,
recruitment of employees, selection and development of managers, initial sales activities and integration
of our systems with those of the companies who will reimburse the location’s replacement renters for
their rentals. A new off-airport location, once opened, takes time to generate its full potential revenues
and, as a result, revenues at new locations do not initially cover their start-up costs and often do not, for
some time, cover the costs of their ongoing operations.
For the year ended December 31, 2006, we believe equipment rental industry pricing, improved in the
United States, Canada, France and Spain. For the years ended December 31, 2007 and 2008, based on
publicly available information, we believe the U.S. equipment rental industry experienced downward
72