Hertz 2008 Annual Report Download - page 88
Download and view the complete annual report
Please find page 88 of the 2008 Hertz annual report below. You can navigate through the pages in the report by either clicking on the pages listed below, or by using the keyword search tool below to find specific information within the annual report.-
 1
1 -
2
-
3
-
4
-
5
-
6
-
7
-
8
-
9
-
10
-
11
-
12
-
13
-
14
-
15
-
16
-
17
-
18
-
19
-
20
-
21
-
22
-
23
-
24
-
25
-
26
-
27
-
28
-
29
-
30
-
31
-
32
-
33
-
34
-
35
-
36
-
37
-
38
-
39
-
40
-
41
-
42
-
43
-
44
-
45
-
46
-
47
-
48
-
49
-
50
-
51
-
52
-
53
-
54
-
55
-
56
-
57
-
58
-
59
-
60
-
61
-
62
-
63
-
64
-
65
-
66
-
67
-
68
-
69
-
70
-
71
-
72
-
73
-
74
-
75
-
76
-
77
-
 78
78 -
 79
79 -
 80
80 -
 81
81 -
 82
82 -
 83
83 -
 84
84 -
 85
85 -
 86
86 -
 87
87 -
 88
88 -
 89
89 -
 90
90 -
 91
91 -
 92
92 -
 93
93 -
 94
94 -
 95
95 -
 96
96 -
 97
97 -
 98
98 -
99
-
100
-
101
-
102
-
103
-
104
-
105
-
106
-
107
-
108
-
109
-
110
-
111
-
112
-
113
-
114
-
115
-
116
-
117
-
118
-
119
-
120
-
121
-
122
-
123
-
124
-
125
-
126
-
127
-
128
-
129
-
130
-
131
-
132
-
133
-
134
-
135
-
136
-
137
-
138
-
139
-
140
-
141
-
142
-
143
-
144
-
145
-
146
-
147
-
148
-
149
-
150
-
151
-
152
-
153
-
154
-
155
-
156
-
157
-
158
-
159
-
160
-
161
-
162
-
163
-
164
-
165
-
166
-
167
-
168
-
169
-
170
-
171
-
172
-
173
-
174
-
175
-
176
-
177
-
178
-
179
-
180
-
181
-
182
-
183
-
184
-
185
-
186
-
187
-
188
-
189
-
190
-
191
-
192
-
193
-
194
-
195
-
196
-
197
-
198
-
199
-
200
-
201
-
202
-
203
-
204
-
205
-
206
-
207
-
208
-
209
-
210
-
211
-
212
-
213
-
214
-
215
-
216
-
217
-
218
-
219
-
220
-
221
-
222
-
223
-
224
-
225
-
226
-
227
-
228
-
229
-
230
-
231
-
232
-
233
-
234
-
235
-
236
-
237
-
238
-
239
-
240
-
241
-
242
-
243
-
244
-
245
-
246
-
247
-
248
-
249
-
250
-
251
-
252
 |
 |

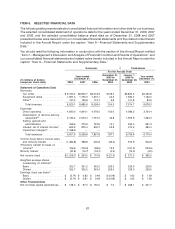
ITEM 6. SELECTED FINANCIAL DATA (Continued)
Successor Predecessor
December 31,
2008 2007 2006 2005 2004
Balance Sheet Data
Cash and equivalents and short-term investments . $ 594.3 $ 730.2 $ 674.5 $ 843.9 $ 1,235.0
Total assets(g) ......................... 16,451.4 19,255.7 18,677.4 18,580.9 14,096.4
Total debt ........................... 10,972.3 11,960.1 12,276.2 12,515.0 8,428.0
Stockholders’ equity(h) ................... 1,470.6 2,913.4 2,534.6 2,266.2 2,670.2
(a) Includes fees and certain cost reimbursements from our licensees and revenues from our car leasing operations and
third-party claim management services.
(b) For the years ended December 31, 2008, 2007 and 2006, the Successor period ended December 31, 2005 and the
Predecessor period ended December 20, 2005, depreciation of revenue earning equipment was increased by
$32.7 million and $0.6 million and reduced by $13.1 million, $1.2 million and $33.8 million, respectively, resulting from
the net effects of changing depreciation rates to reflect changes in the estimated residual value of revenue earning
equipment. For the years ended December 31, 2008, 2007 and 2006, the Successor period ended December 31,
2005, the Predecessor period ended December 20, 2005, and the year ended December 31, 2004, depreciation of
revenue earning equipment includes net losses of $83.1 million and $21.2 million and net gains of $35.9 million,
$2.1 million, $68.3 million and $57.2 million, respectively, from the disposal of revenue earning equipment.
(c) For the years ended December 31, 2008, 2007 and 2006, the Successor period ended December 31, 2005, the
Predecessor period ended December 20, 2005, and the year ended December 31, 2004, interest income was
$24.8 million, $41.3 million, $42.6 million, $1.1 million, $36.1 million and $23.7 million, respectively.
(d) For the year ended December 31, 2008, we recorded non-cash impairment charges related to our goodwill, other
intangible assets and property and equipment.
(e) For the year ended December 31, 2008, we established additional valuation allowances of $53.3 million relating to the
realization of deferred tax assets attributable to net operating losses, credits and other temporary differences in
various jurisdictions. Additionally, certain tax reserves were recorded and certain tax reserves were released due to
settlement for various uncertain tax positions in Federal, state and foreign jurisdictions. For the year ended
December 31, 2007, we reversed a valuation allowance of $9.1 million relating to the realization of deferred tax assets
attributable to net operating losses and other temporary differences in certain European countries. Additionally,
certain tax reserves were recorded for various uncertain tax positions in Federal, state and foreign jurisdictions. For
the year ended December 31, 2006, we established valuation allowances of $9.8 million relating to the realization of
deferred tax assets attributable to net operating losses and other temporary differences in certain European
countries. Additionally, certain tax reserves were recorded for certain federal and state uncertain tax positions. The
Predecessor period ended December 20, 2005 includes the reversal of a valuation allowance on foreign tax credit
carryforwards of $35.0 million (established in 2004) and favorable foreign tax adjustments of $5.3 million relating to
periods prior to 2005, partly offset by a $31.3 million provision relating to the repatriation of foreign earnings. The
Predecessor period ended December 31, 2004 includes benefits of $46.6 million relating to net adjustments to federal
and foreign tax accruals.
(f) Amounts for the Successor period ended December 31, 2005 and the Predecessor periods are computed based
upon 229,500,000 shares of common stock outstanding immediately after the Acquisition applied to our historical net
income (loss) amounts. Amounts for the Successor years ended December 31, 2008, 2007 and 2006 are computed
based on the weighted average shares outstanding during the period applied to our historical net income (loss)
amount.
(g) Substantially all of our revenue earning equipment, as well as certain related assets, are owned by special purpose
entities, or are subject to liens in favor of our lenders under the Senior ABL Facility, our asset-backed securities
program, the International Fleet Debt Facilities, the International ABS Fleet Financing Facility, the fleet financing
facilities relating to our car rental fleets in Hawaii, Kansas, Puerto Rico and St. Thomas, the U.S. Virgin Islands; Brazil;
Canada; Belgium; and our U.K. leveraged financing. Substantially all our other assets in the United States are also
subject to liens in favor of our lenders under our Senior Credit Facilities, and substantially all our other assets outside
the United States are (with certain limited exceptions) subject to liens in favor of our lenders under the International
Fleet Debt Facilities and International ABS Fleet Financing Facility or (in the case of our Canadian HERC business)
our Senior ABL Facility. None of such assets are available to satisfy the claims of our general creditors. For a
description of those facilities, see ‘‘Item 7—Management’s Discussion and Analysis of Financial Condition and
Results of Operations—Liquidity and Capital Resources.’’
(h) Includes net proceeds from the sale of stock to employees and the initial public offering of approximately
$1,284.5 million, equity contributions totaling $2,295.0 million to Hertz Holdings from investment funds associated
with or designated by the Sponsors on or prior to December 21, 2005 and the payment of special cash dividends to
our stockholders of approximately $999.2 million on June 30, 2006 and approximately $260.3 million on
November 21, 2006.
68