Health Net 2015 Annual Report Download - page 6
Download and view the complete annual report
Please find page 6 of the 2015 Health Net annual report below. You can navigate through the pages in the report by either clicking on the pages listed below, or by using the keyword search tool below to find specific information within the annual report.4
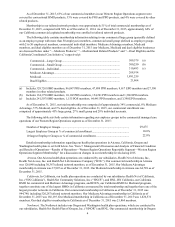
As of December 31, 2015, 63% of our commercial members in our Western Region Operations segment were
covered by conventional HMO products, 33% were covered by POS and PPO products, and 4% were covered by other
related products.
Membership in our tailored network products was approximately 51% of total commercial membership as of
December 31, 2015, compared with 50% as of December 31, 2014. As of December 31, 2015, approximately 64% of
our California commercial capitated membership was enrolled in tailored network products.
The following table contains membership information relating to our commercial large group (generally defined
as an employer group with more than 50 employees) members, commercial small group (defined as employer groups
with 2 to 50 employees) members, commercial individual members, Medicare Advantage members, Medicaid
members, and dual eligibles members as of December 31, 2015 (our Medicare, Medicaid and dual eligibles businesses
are discussed below under “—Medicare Products,” “—Medicaid and Related Products” and “—Dual Eligibles and the
California Coordinated Care Initiative," respectively):
Commercial—Large Group................................................................................. 509,579 (a)
Commercial—Small Group................................................................................. 300,250 (b)
Commercial—Individual..................................................................................... 310,493 (c)
Medicare Advantage............................................................................................ 268,914
Medicaid.............................................................................................................. 1,891,259
Dual Eligibles...................................................................................................... 21,864
___________
(a) Includes 328,726 HMO members, 96,047 POS members, 47,889 PPO members, 9,617 EPO members and 27,300
members in other related products.
(b) Includes 134,379 HMO members, 10,102 POS members, 154,201 PPO members and 1,568 EPO members.
(c) Includes 241,507 HMO members, 1,155 POS members, 64,441 PPO members, and 3,390 EPO members.
As of December 31, 2015, our total membership was comprised of approximately 34% commercial, 8% Medicare
Advantage, 57% Medicaid, and 1% dual eligibles. As of December 31, 2015, our commercial enrollment was
comprised of approximately 45% large group, 27% small group and 28% individual accounts.
The following table sets forth certain information regarding our employer groups in the commercial managed care
operations of our Western Region Operations segment as of December 31, 2015:
Number of Employer Groups................................................................................................ 29,475
Largest Employer Group as % of commercial enrollment.................................................... 10.0%
10 largest Employer Groups as % of commercial enrollment............................................... 22.0%
Detailed membership information regarding our health plan operations in Arizona, California, Oregon and
Washington health plans is set forth below. See “Item 7. Management's Discussion and Analysis of Financial Condition
and Results of Operations—Results of Operations—Western Region Operations Reportable Segment—Western Region
Operations Segment Membership” for a discussion on changes in our membership levels during 2015.
Arizona. Our Arizona health plan operations are conducted by our subsidiaries, Health Net of Arizona, Inc.,
Health Net Access, Inc. and Health Net Life Insurance Company (“HNL”). Our commercial membership in Arizona
was 126,048 including 30,367 tailored network members, as of December 31, 2015. Our Medicare Advantage
membership in Arizona was 37,907 as of December 31, 2015. Our Medicaid membership in Arizona was 64,728 as of
December 31, 2015.
California. In California, our health plan operations are conducted by our subsidiaries Health Net of California,
Inc. (“HN California”), Health Net Community Solutions, Inc. (“HNCS”), and HNL. HN California, our California
HMO for commercial and Medicare Advantage programs, and HNCS, our California HMO for Medicaid programs,
together constitute one of the largest HMOs in California as measured by total membership and together have one of the
largest provider networks in California. Our commercial membership in California as of December 31, 2015 was
944,748, including 526,287 tailored network members. Our Medicare Advantage membership in California as of
December 31, 2015 was 166,193. Our Medicaid membership in California as of December 31, 2015 was 1,826,531
members. Our dual eligibles membership in California as of December 31, 2015 was 21,864 members.
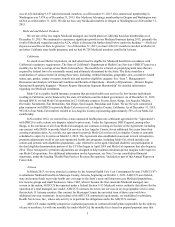
Northwest. The Northwest includes our Oregon and Washington health plan operations, which are conducted by
our subsidiaries, Health Net Health Plan of Oregon, Inc. (“HNOR”) and HNL. Our commercial membership in Oregon

