Hasbro 2015 Annual Report Download - page 96
Download and view the complete annual report
Please find page 96 of the 2015 Hasbro annual report below. You can navigate through the pages in the report by either clicking on the pages listed below, or by using the keyword search tool below to find specific information within the annual report.-
 1
1 -
2
-
3
-
4
-
5
-
6
-
7
-
8
-
9
-
10
-
11
-
12
-
13
-
14
-
15
-
16
-
17
-
18
-
19
-
20
-
21
-
22
-
23
-
24
-
25
-
26
-
27
-
28
-
29
-
30
-
31
-
32
-
33
-
34
-
35
-
36
-
37
-
38
-
39
-
40
-
41
-
42
-
43
-
44
-
45
-
46
-
47
-
48
-
49
-
50
-
51
-
52
-
53
-
54
-
55
-
56
-
57
-
58
-
59
-
60
-
61
-
62
-
63
-
64
-
65
-
66
-
67
-
68
-
69
-
70
-
71
-
72
-
73
-
74
-
75
-
76
-
77
-
78
-
79
-
80
-
81
-
82
-
83
-
84
-
85
-
 86
86 -
 87
87 -
 88
88 -
 89
89 -
 90
90 -
 91
91 -
 92
92 -
 93
93 -
 94
94 -
 95
95 -
 96
96 -
 97
97 -
 98
98 -
 99
99 -
 100
100 -
 101
101 -
 102
102 -
 103
103 -
 104
104 -
 105
105 -
 106
106 -
107
-
108
-
109
-
110
-
111
-
112
-
113
-
114
-
115
-
116
-
117
-
118
-
119
-
120
-
121
-
122
-
123
-
124
-
125
-
126
 |
 |

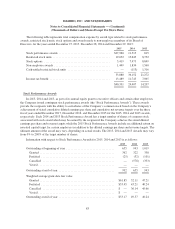
HASBRO, INC. AND SUBSIDIARIES
Notes to Consolidated Financial Statements — (Continued)
(Thousands of Dollars and Shares Except Per Share Data)
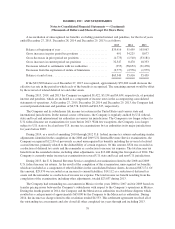
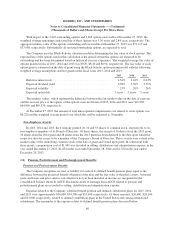
The Company used a Monte Carlo simulation valuation model to determine the fair value of these awards.
The following inputs were used in the simulation that resulted in an average grant date fair value for this award
of $35.56:
Inputs
Grant date stock price ......................................................... $47.28
Stock price volatility ......................................................... 26.12%
Risk-free interest rate ......................................................... 0.65%
Dividend yield .............................................................. 3.38%
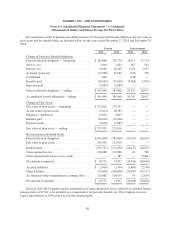
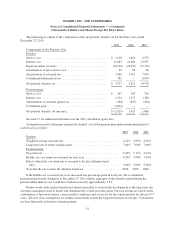
Excluding the aforementioned award for 587 shares, information with respect to the remaining Restricted
Stock Awards and Restricted Stock Units for 2015, 2014 and 2013 is as follows:
2015 2014 2013
Outstanding at beginning of year ................................. 937 702 296
Granted ................................................... 254 281 451
Forfeited .................................................. (52) (39) (44)
Vested .................................................... (184) (7) (1)
Outstanding at end of year ...................................... 955 937 702
Weighted average grant-date fair value:
Granted ................................................... $62.95 52.06 45.16
Forfeited .................................................. $51.57 44.44 40.40
Vested .................................................... $39.87 41.19 33.62
Outstanding at end of year ...................................... $51.22 45.74 43.10
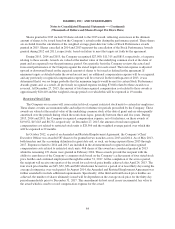
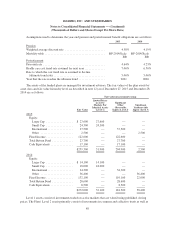
Stock Options
Information with respect to stock options for the three years ended December 27, 2015 is as follows:
2015 2014 2013
Outstanding at beginning of year ............................... 4,186 5,543 9,283
Granted ................................................. 549 684 776
Exercised ............................................... (1,280) (1,951) (4,377)
Expired or forfeited ....................................... (10) (90) (139)
Outstanding at end of year .................................... 3,445 4,186 5,543
Exercisable at end of year .................................... 2,208 2,374 3,144
Weighted average exercise price:
Granted ................................................. $61.77 52.11 47.21
Exercised ............................................... $37.54 31.07 26.99
Expired or forfeited ....................................... $46.38 39.85 39.59
Outstanding at end of year .................................. $46.41 41.68 36.63
Exercisable at end of year .................................. $41.36 38.90 33.22
85