Hasbro 2009 Annual Report Download - page 84
Download and view the complete annual report
Please find page 84 of the 2009 Hasbro annual report below. You can navigate through the pages in the report by either clicking on the pages listed below, or by using the keyword search tool below to find specific information within the annual report.-
 1
1 -
2
-
3
-
4
-
5
-
6
-
7
-
8
-
9
-
10
-
11
-
12
-
13
-
14
-
15
-
16
-
17
-
18
-
19
-
20
-
21
-
22
-
23
-
24
-
25
-
26
-
27
-
28
-
29
-
30
-
31
-
32
-
33
-
34
-
35
-
36
-
37
-
38
-
39
-
40
-
41
-
42
-
43
-
44
-
45
-
46
-
47
-
48
-
49
-
50
-
51
-
52
-
53
-
54
-
55
-
56
-
57
-
58
-
59
-
60
-
61
-
62
-
63
-
64
-
65
-
66
-
67
-
68
-
69
-
70
-
71
-
72
-
73
-
 74
74 -
 75
75 -
 76
76 -
 77
77 -
 78
78 -
 79
79 -
 80
80 -
 81
81 -
 82
82 -
 83
83 -
 84
84 -
 85
85 -
 86
86 -
 87
87 -
 88
88 -
 89
89 -
 90
90 -
 91
91 -
 92
92 -
 93
93 -
 94
94 -
95
-
96
-
97
-
98
-
99
-
100
-
101
-
102
-
103
-
104
-
105
-
106
-
107
-
108
 |
 |

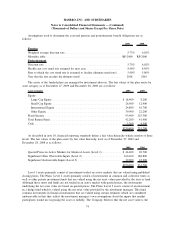
Assumptions used to determine the year-end pension and postretirement benefit obligations are as
follows:
2009 2008
Pension
Weighted average discount rate ................................... 5.73% 6.20%
Mortality table . . . ............................................ RP-2000 RP-2000
Postretirement
Discount rate ................................................ 5.75% 6.02%
Health care cost trend rate assumed for next year ..................... 8.00% 8.50%
Rate to which the cost trend rate is assumed to decline (ultimate trend rate) . . 5.00% 5.00%
Year that the rate reaches the ultimate trend ......................... 2018 2016
The assets of the funded plans are managed by investment advisors. The fair values of the plan assets by
asset category as of December 27, 2009 and December 28, 2008 are as follows:
Asset Category 2009 2008
Equity:
Large Cap Equity ........................................... $ 18,400 8,200
Small Cap Equity ........................................... 26,500 12,900
International Equity .......................................... 24,800 16,700
Other Equity ............................................... 39,900 22,200
Fixed Income ................................................ 93,400 125,300
Total Return Fund ............................................. 42,200 41,900
Cash ....................................................... 5,200 4,500
$250,400 231,700
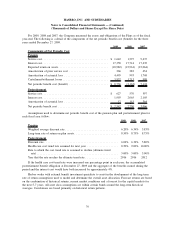
As described in note 10, financial reporting standards define a fair value hierarchy which consists of three
levels. The fair values of the plan assets by fair value hierarchy level as of December 27, 2009 and
December 28, 2008 is as follows:
2009 2008
Quoted Prices in Active Markets for Identical Assets (Level 1)............ $ 44,400 20,700
Significant Other Observable Inputs (Level 2) ........................ 166,100 188,800
Significant Unobservable Inputs (Level 3) ........................... 39,900 22,200
$250,400 231,700
Level 1 assets primarily consist of investments traded on active markets that are valued using published
closing prices. The Plans’ Level 2 assets primarily consist of investments in common and collective trusts as
well as other private investment funds that are valued using the net asset values provided by the trust or fund.
Although these trusts and funds are not traded in an active market with quoted prices, the investments
underlying the net asset value are based on quoted prices. The Plans’ Level 3 assets consist of an investment
in a hedge fund which is valued using the net asset value provided by the investment manager. This fund
contains investments in financial instruments that are valued using certain estimates which are considered
unobservable in that they reflect the investment manager’s own assumptions about the inputs that market
participants would use in pricing the asset or liability. The Company believes that the net asset value is the
74
HASBRO, INC. AND SUBSIDIARIES
Notes to Consolidated Financial Statements — (Continued)
(Thousands of Dollars and Shares Except Per Share Data)