Hasbro 2009 Annual Report Download - page 35
Download and view the complete annual report
Please find page 35 of the 2009 Hasbro annual report below. You can navigate through the pages in the report by either clicking on the pages listed below, or by using the keyword search tool below to find specific information within the annual report.-
 1
1 -
2
-
3
-
4
-
5
-
6
-
7
-
8
-
9
-
10
-
11
-
12
-
13
-
14
-
15
-
16
-
17
-
18
-
19
-
20
-
21
-
22
-
23
-
24
-
 25
25 -
 26
26 -
 27
27 -
 28
28 -
 29
29 -
 30
30 -
 31
31 -
 32
32 -
 33
33 -
 34
34 -
 35
35 -
 36
36 -
 37
37 -
 38
38 -
 39
39 -
 40
40 -
 41
41 -
 42
42 -
 43
43 -
 44
44 -
 45
45 -
46
-
47
-
48
-
49
-
50
-
51
-
52
-
53
-
54
-
55
-
56
-
57
-
58
-
59
-
60
-
61
-
62
-
63
-
64
-
65
-
66
-
67
-
68
-
69
-
70
-
71
-
72
-
73
-
74
-
75
-
76
-
77
-
78
-
79
-
80
-
81
-
82
-
83
-
84
-
85
-
86
-
87
-
88
-
89
-
90
-
91
-
92
-
93
-
94
-
95
-
96
-
97
-
98
-
99
-
100
-
101
-
102
-
103
-
104
-
105
-
106
-
107
-
108
 |
 |

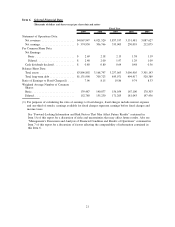
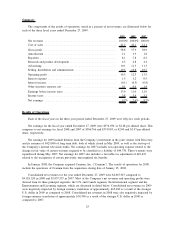
Summary
The components of the results of operations, stated as a percent of net revenues, are illustrated below for
each of the three fiscal years ended December 27, 2009.
2009 2008 2007
Net revenues .............................................. 100.0% 100.0% 100.0%
Cost of sales .............................................. 41.2 42.1 41.1
Gross profit ............................................... 58.8 57.9 58.9
Amortization .............................................. 2.1 1.9 1.8
Royalties ................................................. 8.1 7.8 8.2
Research and product development .............................. 4.5 4.8 4.4
Advertising ............................................... 10.1 11.3 11.3
Selling, distribution and administration ........................... 19.5 19.8 19.7
Operating profit ............................................ 14.5 12.3 13.5
Interest expense ............................................ 1.5 1.2 0.9
Interest income............................................. (0.1) (0.5) (0.8)
Other (income) expense, net ................................... 0.1 0.6 1.4
Earnings before income taxes .................................. 13.0 11.0 12.0
Income taxes .............................................. 3.8 3.4 3.3
Net earnings ............................................... 9.2% 7.6% 8.7%
Results of Operations
Each of the fiscal years in the three-year period ended December 27, 2009 were fifty-two week periods.
Net earnings for the fiscal year ended December 27, 2009 were $374,930, or $2.48 per diluted share. This
compares to net earnings for fiscal 2008 and 2007 of $306,766 and $333,003, or $2.00 and $1.97 per diluted
share, respectively.
Net earnings for 2009 include dilution from the Company’s investment in the joint venture with Discovery
and its issuance of $425,000 of long-term debt, both of which closed in May 2009, as well as the start-up of
the Company’s internal television studio. Net earnings for 2007 includes non-operating expense related to the
change in fair value of certain warrants required to be classified as a liability of $44,370. These warrants were
repurchased during May 2007. Net earnings for 2007 also includes a favorable tax adjustment of $29,619
related to the recognition of certain previously unrecognized tax benefits.
In January 2008, the Company acquired Cranium, Inc. (“Cranium”). The results of operations for 2008
include the operations of Cranium from the acquisition closing date of January 25, 2008.
Consolidated net revenues for the year ended December 27, 2009 were $4,067,947 compared to
$4,021,520 in 2008 and $3,837,557 in 2007. Most of the Company’s net revenues and operating profits were
derived from its three principal segments: the U.S. and Canada segment, the International segment and the
Entertainment and Licensing segment, which are discussed in detail below. Consolidated net revenues in 2009
were negatively impacted by foreign currency translation of approximately $65,200 as a result of the stronger
U.S. dollar in 2009 as compared to 2008. Consolidated net revenues in 2008 were also negatively impacted by
foreign currency translation of approximately $10,300 as a result of the stronger U.S. dollar in 2008 as
compared to 2007.
25