Hasbro 2009 Annual Report Download - page 3
Download and view the complete annual report
Please find page 3 of the 2009 Hasbro annual report below. You can navigate through the pages in the report by either clicking on the pages listed below, or by using the keyword search tool below to find specific information within the annual report.-
 1
1 -
 2
2 -
 3
3 -
 4
4 -
 5
5 -
 6
6 -
 7
7 -
 8
8 -
 9
9 -
 10
10 -
 11
11 -
 12
12 -
 13
13 -
 14
14 -
15
-
16
-
17
-
18
-
19
-
20
-
21
-
22
-
23
-
24
-
25
-
26
-
27
-
28
-
29
-
30
-
31
-
32
-
33
-
34
-
35
-
36
-
37
-
38
-
39
-
40
-
41
-
42
-
43
-
44
-
45
-
46
-
47
-
48
-
49
-
50
-
51
-
52
-
53
-
54
-
55
-
56
-
57
-
58
-
59
-
60
-
61
-
62
-
63
-
64
-
65
-
66
-
67
-
68
-
69
-
70
-
71
-
72
-
73
-
74
-
75
-
76
-
77
-
78
-
79
-
80
-
81
-
82
-
83
-
84
-
85
-
86
-
87
-
88
-
89
-
90
-
91
-
92
-
93
-
94
-
95
-
96
-
97
-
98
-
99
-
100
-
101
-
102
-
103
-
104
-
105
-
106
-
107
-
108
 |
 |

TO OUR SHAREHOLDERS
2009 was an excellent year for Hasbro. Across our business, Hasbro employees came together around
the world to deliver our fi fth consecutive year of revenue growth and ninth consecutive year of EPS
growth. These results refl ect our strategy to invest in our business for the long term while returning
cash to you, our shareholders. In fact, in 2009 we returned approximately $200 million to our
shareholders through our dividend and share buyback programs. In early 2010, we were pleased to be
able to increase our quarterly dividend 25% to $0.25 per common share.
We achieved these results despite a challenging global economic environment - an environment which
did not improve signifi cantly in 2009, but also did not deteriorate further. Throughout the year, we
stayed committed to our strategy, adapting it to best meet changing consumer spending habits. As a
result, we were well positioned for when the consumer came out to shop – and the consumer did come
out to shop - albeit late in the fourth quarter.
THE CONSUMER IS IN CHARGE
We know fully and fundamentally that the consumer is in charge. Our teams around the world are
spending more time and attention garnering consumer insights. Specifi cally, how they consume
brands, particularly Hasbro brands, how they consume media and the opportunities we have to drive
our brands forward. This is the fundamental job of the Company and at the core of the strategy
we employ.
Our core brand strategy is simple. We create immersive brand experiences for consumers of all ages
in any form or format they want, anytime or anywhere, around the world.
Our brand blueprint is the starting point. Two years ago, we rewired the organization to put brands
at the very center of everything we do as we re-imagine, re-invent and re-ignite our brands. It begins
with toy and game product innovation and extends to all consumer touch points including lifestyle
licensing, entertainment – television, movies and online – as well as digital gaming. We then employ
this blueprint across our mature, developing and emerging markets.
In 2001, we established our core brand strategy because we believed it would deliver superior
experiences for our consumers and retail partners, provide long-term growth for our business and
create value for our shareholders. Today, we can tell you it is working.
As we create bigger, global core brands, we leverage our investments across geographies while
investing in sales, marketing and R&D globally to deliver stronger operating returns over time. In 2001,
our eight global core brands (G.I. JOE; LITTLEST PET SHOP; MAGIC: THE GATHERING; MONOPOLY;
MY LITTLE PONY; NERF; PLAYSKOOL; and TRANSFORMERS) represented 17% of Hasbro’s total
revenues. This increased to 25% by 2005 and in 2009 these brands grew to represent 50% of total
Hasbro net revenues.
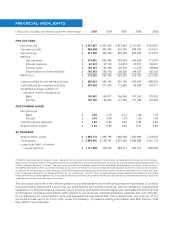
During the same time period, operating margins grew from 7.4% in 2001 to 14.5% in 2009, a level
Hasbro has not achieved since the mid-1980s and we achieved a record operating profi t in 2009 of
$588.6 million. We also returned approximately $2 billion in cash to shareholders via dividends and
stock buybacks in that same time period from 2001 to 2009.
Throughout 2009, the Hasbro team pulled together to increase operating e ciencies in our business.
At the beginning of the year, we outlined cost-saving initiatives, including freezing salaries, hiring only
in critical positions and reducing other expenses including travel. These e orts, combined with a focus
on prudent spending, resulted in an overall reduction in costs within our business, which is the baseline
we began from in 2010.