Harris Teeter 2012 Annual Report Download - page 12
Download and view the complete annual report
Please find page 12 of the 2012 Harris Teeter annual report below. You can navigate through the pages in the report by either clicking on the pages listed below, or by using the keyword search tool below to find specific information within the annual report.-
 1
1 -
 2
2 -
 3
3 -
 4
4 -
 5
5 -
 6
6 -
 7
7 -
 8
8 -
 9
9 -
 10
10 -
 11
11 -
 12
12 -
 13
13 -
 14
14 -
 15
15 -
 16
16 -
 17
17 -
 18
18 -
 19
19 -
 20
20 -
 21
21 -
 22
22 -
23
-
24
-
25
-
26
-
27
-
28
-
29
-
30
-
31
-
32
-
33
-
34
-
35
-
36
-
37
-
38
-
39
-
40
-
41
-
42
-
43
-
44
-
45
-
46
-
47
-
48
-
49
-
50
-
51
-
52
-
53
-
54
-
55
-
56
-
57
-
58
-
59
-
60
-
61
-
62
-
63
-
64
-
65
-
66
-
67
-
68
-
69
-
70
-
71
-
72
-
73
-
74
-
75
-
76
-
77
-
78
-
79
-
80
-
81
-
82
-
83
-
84
-
85
-
86
-
87
-
88
-
89
-
90
-
91
-
92
-
93
-
94
-
95
-
96
-
97
-
98
-
99
-
100
-
101
-
102
-
103
-
104
-
105
-
106
-
107
-
108
-
109
-
110
-
111
-
112
-
113
-
114
-
115
-
116
-
117
-
118
-
119
-
120
-
121
-
122
-
123
-
124
-
125
-
126
-
127
-
128
 |
 |

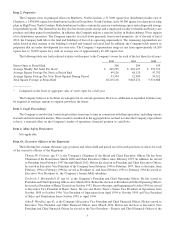
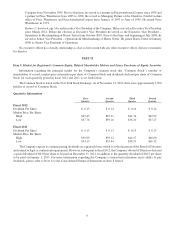
Issuer Purchases of Equity Securities
The following table summarizes the Company’s purchases of its common stock during the quarter ended October 2, 2012.
Period
Total Number
of Shares
Purchased
Average
Price Paid
per Share
Total Number of
Shares Purchased as
Part of Publicly
Announced Plans or
Programs (1)
Maximum Number
of Shares that May
Yet Be Purchased
Under the Plans or
Programs
July 2, 2012 to August 5, 2012 - 0 - n.a. - 0 - 2,767,169
August 6, 2012 to September 2, 2012 - 0 - n.a. - 0 - 2,767,169
September 3, 2012 to October 2, 2012 - 0 - n.a. - 0 - 2,767,169
Total - 0 - n.a. - 0 - 2,767,169
______________
(1) In February 1996, the Company announced the adoption of a stock buyback program, authorizing, at management’s
discretion, the Company to purchase and retire up to 4,639,989 shares, 10% of the then-outstanding shares of the
Company’s common stock, for the purpose of preventing dilution as a result of the operation of the Company’s
comprehensive stock option and awards plans. The stock purchases are effected from time to time pursuant to this
authorization. As of October 2, 2012, the Company had purchased and retired 1,872,820 shares under this
authorization. No stock purchases were made during the quarter ended October 2, 2012. The stock buyback program
has no set expiration or termination date.
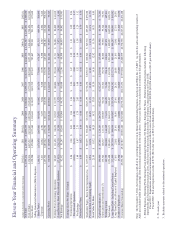
Item 6. Selected Financial Data
As previously disclosed, the Company sold all of its ownership interest in its thread manufacturing business, A&E, on
November 7, 2011. As such, the sales and operating results of A&E are included within earnings (loss) from discontinued
operations in the table below. Prior years have been reclassified to conform to the presentation used in fiscal 2012. For a
discussion of certain factors that materially affect the comparability of the selected financial data or cause the data reflected
herein not to be indicative of our future results of operations or financial condition, see “Management’s Discussion and Analysis
of Financial Condition and Results of Operations—Results of Operations—Discontinued Operations” included in Item 7 hereof.
The following table sets forth selected financial data of the Company as of and for each of the years in the five-year period
ended October 2, 2012 and should be read in conjunction with “Management’s Discussion and Analysis of Financial Condition
and Results of Operations” included in Item 7 hereof and our Consolidated Financial Statements and notes thereto included
in Item 8 hereof (dollars in thousands, except per share data).
2012 2011 2010 2009 2008
Net Sales $4,535,414 $4,285,565 $4,009,353 $3,827,005 $3,664,804
Operating Profit 170,978 180,706 176,856 168,114 169,901
Earnings from Continuing Operations, Net of Taxes 99,927 111,458 98,652 93,597 93,577
Earnings (Loss) from Discontinued Operations, Net of
Taxes (17,415) (20,211) 13,389 (7,633) 3,175
Net Earnings 82,512 91,247 112,041 85,964 96,752
Earnings (Loss) Per Share – Basic:
Continuing Operations 2.05 2.30 2.05 1.95 1.96
Discontinued Operations (0.36) (0.42) 0.28 (0.16) 0.07
Net Earnings 1.69 1.88 2.32 1.79 2.02
Earnings (Loss) Per Share – Diluted:
Continuing Operations 2.04 2.28 2.03 1.94 1.94
Discontinued Operations (0.36) (0.41) 0.28 (0.16) 0.07
Net Earnings 1.68 1.87 2.31 1.78 2.00
Dividend per share 0.55 0.52 0.48 0.48 0.48
Total Assets 1,952,488 1,984,424 1,893,671 1,844,321 1,696,407
Long-Term Debt – including Current Portion 212,490 287,330 306,096 363,427 316,986
8