HSBC 2003 Annual Report Download - page 269
Download and view the complete annual report
Please find page 269 of the 2003 HSBC annual report below. You can navigate through the pages in the report by either clicking on the pages listed below, or by using the keyword search tool below to find specific information within the annual report.-
 1
1 -
2
-
3
-
4
-
5
-
6
-
7
-
8
-
9
-
10
-
11
-
12
-
13
-
14
-
15
-
16
-
17
-
18
-
19
-
20
-
21
-
22
-
23
-
24
-
25
-
26
-
27
-
28
-
29
-
30
-
31
-
32
-
33
-
34
-
35
-
36
-
37
-
38
-
39
-
40
-
41
-
42
-
43
-
44
-
45
-
46
-
47
-
48
-
49
-
50
-
51
-
52
-
53
-
54
-
55
-
56
-
57
-
58
-
59
-
60
-
61
-
62
-
63
-
64
-
65
-
66
-
67
-
68
-
69
-
70
-
71
-
72
-
73
-
74
-
75
-
76
-
77
-
78
-
79
-
80
-
81
-
82
-
83
-
84
-
85
-
86
-
87
-
88
-
89
-
90
-
91
-
92
-
93
-
94
-
95
-
96
-
97
-
98
-
99
-
100
-
101
-
102
-
103
-
104
-
105
-
106
-
107
-
108
-
109
-
110
-
111
-
112
-
113
-
114
-
115
-
116
-
117
-
118
-
119
-
120
-
121
-
122
-
123
-
124
-
125
-
126
-
127
-
128
-
129
-
130
-
131
-
132
-
133
-
134
-
135
-
136
-
137
-
138
-
139
-
140
-
141
-
142
-
143
-
144
-
145
-
146
-
147
-
148
-
149
-
150
-
151
-
152
-
153
-
154
-
155
-
156
-
157
-
158
-
159
-
160
-
161
-
162
-
163
-
164
-
165
-
166
-
167
-
168
-
169
-
170
-
171
-
172
-
173
-
174
-
175
-
176
-
177
-
178
-
179
-
180
-
181
-
182
-
183
-
184
-
185
-
186
-
187
-
188
-
189
-
190
-
191
-
192
-
193
-
194
-
195
-
196
-
197
-
198
-
199
-
200
-
201
-
202
-
203
-
204
-
205
-
206
-
207
-
208
-
209
-
210
-
211
-
212
-
213
-
214
-
215
-
216
-
217
-
218
-
219
-
220
-
221
-
222
-
223
-
224
-
225
-
226
-
227
-
228
-
229
-
230
-
231
-
232
-
233
-
234
-
235
-
236
-
237
-
238
-
239
-
240
-
241
-
242
-
243
-
244
-
245
-
246
-
247
-
248
-
249
-
250
-
251
-
252
-
253
-
254
-
255
-
256
-
257
-
258
-
 259
259 -
 260
260 -
 261
261 -
 262
262 -
 263
263 -
 264
264 -
 265
265 -
 266
266 -
 267
267 -
 268
268 -
 269
269 -
 270
270 -
 271
271 -
 272
272 -
 273
273 -
 274
274 -
 275
275 -
 276
276 -
 277
277 -
 278
278 -
 279
279 -
280
-
281
-
282
-
283
-
284
-
285
-
286
-
287
-
288
-
289
-
290
-
291
-
292
-
293
-
294
-
295
-
296
-
297
-
298
-
299
-
300
-
301
-
302
-
303
-
304
-
305
-
306
-
307
-
308
-
309
-
310
-
311
-
312
-
313
-
314
-
315
-
316
-
317
-
318
-
319
-
320
-
321
-
322
-
323
-
324
-
325
-
326
-
327
-
328
-
329
-
330
-
331
-
332
-
333
-
334
-
335
-
336
-
337
-
338
-
339
-
340
-
341
-
342
-
343
-
344
-
345
-
346
-
347
-
348
-
349
-
350
-
351
-
352
-
353
-
354
-
355
-
356
-
357
-
358
-
359
-
360
-
361
-
362
-
363
-
364
-
365
-
366
-
367
-
368
-
369
-
370
-
371
-
372
-
373
-
374
-
375
-
376
-
377
-
378
-
379
-
380
-
381
-
382
-
383
-
384
 |
 |

267
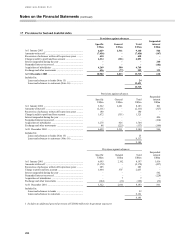
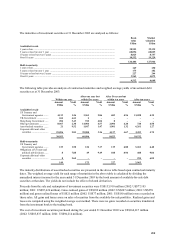
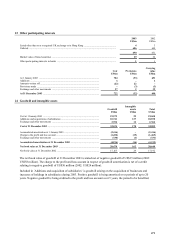
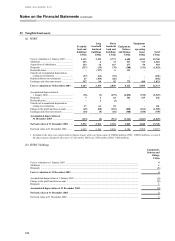
Where securities are carried at market value, and the market value is higher than cost, the difference between cost
and market value is not disclosed as it cannot be determined without unreasonable expense.
The above market valuations do not take account of transactions entered into to hedge the value of HSBC’ s
investment securities. If the market value of such hedges was included, the effective value of investment securities
would be US$132,076 million (2002: US$109,204 million; 2001: US$94,100 million).
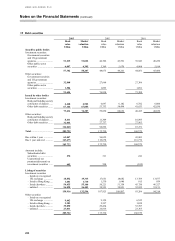
Investment securities
Cost Provisions Book value
US$m US$m US$m
At 1 January 2003 ........................................................................................... 108,040 (115) 107,925
Additions ......................................................................................................... 164,817 – 164,817
Acquisition of subsidiaries .............................................................................. 4,041 – 4,041
Disposals and amounts repaid ......................................................................... (153,752) 29 (153,723)
Provisions made .............................................................................................. – (32) (32)
Amortisation of discounts and premiums ........................................................ (569) – (569)
Exchange and other movements ...................................................................... 8,460 (3) 8,457
At 31 December 2003 .................................................................................... 131,037 (121) 130,916
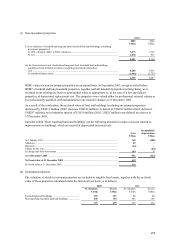
The book value of investment securities, analysed by type of borrower, is as follows:
2003 2002 2001
US$m US$m US$m
Available-for-sale
US Treasury and Government agencies ........................................................... 19,215 18,574 17,452
UK Government .............................................................................................. 554 1,064 1,880
Hong Kong Government ................................................................................. 1,124 1,042 490
Other governments .......................................................................................... 26,685 18,067 16,212
Asset-backed securities ................................................................................... 7,200 3,697 4,535
Corporate debt and other securities ................................................................. 71,626 60,852 48,021
126,404 103,296 88,590
Held-to-maturity
US Treasury and Government agencies ........................................................... 3,637 3,918 3,907
Obligations of US state and political sub-divisions .......................................... 573 673 769
Corporate debt and other securities .................................................................. 302 38 –
4,512 4,629 4,676
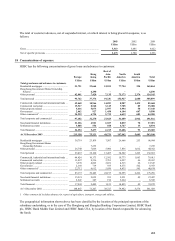
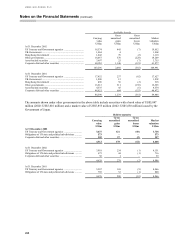
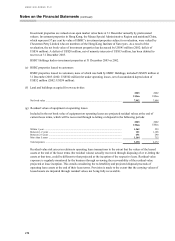
The following table provides an analysis of gross unrealised gains and losses for investment securities by instrument
type as at 31 December for the past three years:
Available-for-sale
Carrying
value
Gross
unrealised
gains
Gross
unrealised
losses
Market
valuation
US$m US$m US$m US$m
At 31 December 2003
US Treasury and Government agencies ........................... 19,215 224 (155) 19,284
UK Government .............................................................. 554 – (1) 553
Hong Kong Government ................................................. 1,124 65 – 1,189
Other governments .......................................................... 26,685 427 (34) 27,078
Asset-backed securities ................................................... 7,200 131 (9) 7,322
Corporate debt and other securities ................................. 71,626 1,007 (113) 72,520
126,404 1,854 (312) 127,946