Google 2014 Annual Report Download - page 37
Download and view the complete annual report
Please find page 37 of the 2014 Google annual report below. You can navigate through the pages in the report by either clicking on the pages listed below, or by using the keyword search tool below to find specific information within the annual report.-
 1
1 -
2
-
3
-
4
-
5
-
6
-
7
-
8
-
9
-
10
-
11
-
12
-
13
-
14
-
15
-
16
-
17
-
18
-
19
-
20
-
21
-
22
-
23
-
24
-
25
-
26
-
 27
27 -
 28
28 -
 29
29 -
 30
30 -
 31
31 -
 32
32 -
 33
33 -
 34
34 -
 35
35 -
 36
36 -
 37
37 -
 38
38 -
 39
39 -
 40
40 -
 41
41 -
 42
42 -
 43
43 -
 44
44 -
 45
45 -
 46
46 -
 47
47 -
48
-
49
-
50
-
51
-
52
-
53
-
54
-
55
-
56
-
57
-
58
-
59
-
60
-
61
-
62
-
63
-
64
-
65
-
66
-
67
-
68
-
69
-
70
-
71
-
72
-
73
-
74
-
75
-
76
-
77
-
78
-
79
-
80
-
81
-
82
-
83
-
84
-
85
-
86
-
87
-
88
-
89
-
90
-
91
-
92
 |
 |

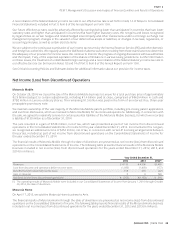
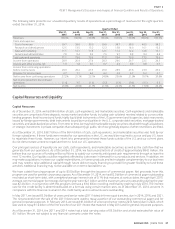
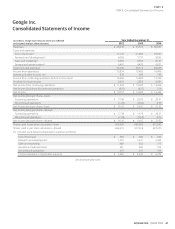
The following table presents our unaudited quarterly results of operations as a percentage of revenues for the eight quarters
ended December 31, 2014:
Quarter Ended
Mar31,
2013
Jun30,
2013
Sep30,
2013
Dec31,
2013
Mar31,
2014
Jun30,
2014
Sep30,
2014
Dec31,
2014
Revenues 100.0% 100.0% 100.0% 100.0% 100.0% 100.0% 100.0% 100.0%
Costs and expenses:
Cost of revenues 39.7 39.6 39.3 39.8 38.7 38.3 40.5 38.2
Research and development 12.5 13.5 13.2 12.3 13.8 14.0 16.1 15.5
Sales and marketing 11.1 12.1 11.8 12.1 11.2 12.2 12.6 13.1
General and administrative 7.8 8.4 8.3 7.5 9.7 8.8 8.3 8.8
Total costs and expenses 71.1 73.6 72.6 71.7 73.4 73.3 77.5 75.6
Income from operations 28.9 26.4 27.4 28.3 26.6 26.7 22.5 24.3
Interest and other income, net 1.0 1.8 0.1 0.7 2.3 0.9 0.8 0.7
Income from continuing operations
before income taxes 29.9 28.2 27.5 29.0 28.9 27.6 23.3 25.0
Provision for income taxes 2.7 7.1 4.4 4.2 5.3 5.7 5.2 4.1
Net income from continuing operations 27.2% 21.1% 23.1% 24.8% 23.6% 21.9% 18.1% 20.9%
Net income (loss) from discontinued
operations (1.4) 3.5 (1.4) (3.2) (1.3) (0.4) (1.1) 5.3
Net income 25.8% 24.6% 21.7% 21.6% 22.3% 21.5% 17.0% 26.2%
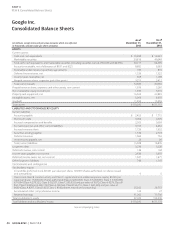
Capital Resources and Liquidity
Capital Resources
As of December 31, 2014, we had $64.4 billion of cash, cash equivalents, and marketable securities. Cash equivalents and marketable
securities are comprised of time deposits, money market and other funds, including cash collateral received related to our securities
issued by foreign governments, debt instruments issued by municipalities in the U.S., corporate debt securities, mortgage-backed
securities, and asset-backed securities. From time to time, we may hold marketable equity securities obtained through acquisitions
or strategic investments in private companies that subsequently go public, which we generally dispose of when restrictions are lifted.
As of December 31, 2014, $38.7 billion of the $64.4 billion of cash, cash equivalents, and marketable securities was held by our
foreign subsidiaries. If these funds were needed for our operations in the U.S., we would be required to accrue and pay U.S. taxes
to repatriate these funds. However, our intent is to permanently reinvest these funds outside of the U.S. and our current plans
do not demonstrate a need to repatriate them to fund our U.S. operations.
generate from our operations. As of December 31, 2014, we had unused letters of credit of approximately $842 million. We
may make acquisitions, increase our capital expenditures, or license products and technologies complementary to our business
program are used for general corporate purposes. As of December 31, 2014, we had $2.0 billion of commercial paper outstanding
recorded as short-term debt, with a weighted-average interest rate of 0.1% that matures at various dates through April 2015.
Average commercial paper borrowings during the year were $2.1 billion and the maximum amount outstanding during the year
was $2.4billion. In conjunction with this program, we have a $3.0 billion revolving credit facility expiring in July 2016. The interest
rate for the credit facility is determined based on a formula using certain market rates. As of December 31, 2014, we were in
In May 2011, we issued $3.0 billion of unsecured senior notes (2011 Notes) in three equal tranches, due in 2014, 2016, and 2021.
The net proceeds from the sale of the 2011 Notes were used to repay a portion of our outstanding commercial paper and for
general corporate purposes. In February 2014, we issued $1.0 billion of unsecured senior notes (2014 Notes) due in 2024, which
As of December 31, 2014, the 2011 and 2014 notes had a total carrying value of $3.0 billion and a total estimated fair value of
31GOOGLE INC.