Google 2014 Annual Report Download - page 28
Download and view the complete annual report
Please find page 28 of the 2014 Google annual report below. You can navigate through the pages in the report by either clicking on the pages listed below, or by using the keyword search tool below to find specific information within the annual report.-
 1
1 -
2
-
3
-
4
-
5
-
6
-
7
-
8
-
9
-
10
-
11
-
12
-
13
-
14
-
15
-
16
-
17
-
 18
18 -
 19
19 -
 20
20 -
 21
21 -
 22
22 -
 23
23 -
 24
24 -
 25
25 -
 26
26 -
 27
27 -
 28
28 -
 29
29 -
 30
30 -
 31
31 -
 32
32 -
 33
33 -
 34
34 -
 35
35 -
 36
36 -
 37
37 -
 38
38 -
39
-
40
-
41
-
42
-
43
-
44
-
45
-
46
-
47
-
48
-
49
-
50
-
51
-
52
-
53
-
54
-
55
-
56
-
57
-
58
-
59
-
60
-
61
-
62
-
63
-
64
-
65
-
66
-
67
-
68
-
69
-
70
-
71
-
72
-
73
-
74
-
75
-
76
-
77
-
78
-
79
-
80
-
81
-
82
-
83
-
84
-
85
-
86
-
87
-
88
-
89
-
90
-
91
-
92
 |
 |

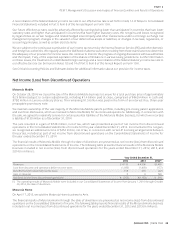
Motorola
On May 22, 2012, we acquired Motorola Mobility Holdings, Inc. (Motorola), consisting of the Motorola Home and Motorola
Motorola Home were included in net income (loss) from discontinued operations on the Consolidated Statements of Income for
the years ended December 31, 2012 and 2013. On October 29, 2014 we sold the Motorola Mobile business to Lenovo Group
the Consolidated Statements of Income for the years ended December 31, 2012, 2013, and 2014.
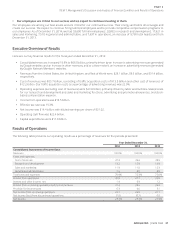
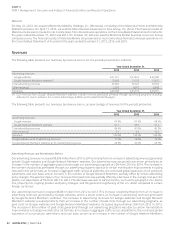
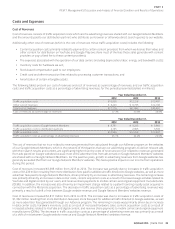
Revenues
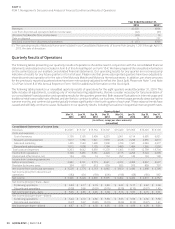
The following table presents our revenues, by revenue source, for the periods presented (in millions):
Year Ended December31,
2012 2013 2014
Advertising revenues:
Google websites $31,221 $37,422 $ 45,085
(1) 12,465 13,125 13,971
Total advertising revenues 43,686 50,547 59,056
Other revenues 2,353 4,972 6,945
Revenues $46,039 $55,519 $ 66,001
AdSense for search, AdSense for content, AdExchange, AdMob, and DoubleClick Bid Manager.
The following table presents our revenues, by revenue source, as a percentage of revenues for the periods presented:
Year Ended December31,
2012 2013 2014
Advertising revenues:
Google websites 67.8% 67.4% 68.3%
27.1 23.6 21.2
Total advertising revenues 94.9% 91.0% 89.5%
Other revenues 5.1 9.0 10.5
Revenues 100.0% 100.0% 100.0%
Google websites as % of advertising revenues 71.5% 74.0% 76.3%
28.5% 26.0% 23.7%
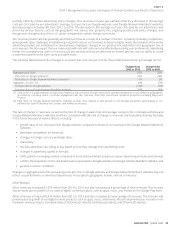
Advertising Revenues and Monetization Metrics
Our advertising revenues increased $8,509 million from 2013 to 2014 primarily from an increase in advertising revenues generated
increase in the number of aggregate paid clicks through our advertising programs of 20% from 2013 to 2014. The increase in
the number of paid clicks generated through our advertising programs was due to certain monetization improvements including
paid by our advertisers of 5% from 2013 to 2014. The decrease was due to various factors, such as the geographic mix, device
mix, property mix, ongoing product and policy changes, and the general strengthening of the U.S. dollar compared to certain
foreign currencies.
Our advertising revenues increased $6,861 million from 2012 to 2013. This increase resulted primarily from an increase in
advertising revenues generated by Google websites, and to a lesser extent, an increase in advertising revenues generated
The increase in the number of paid clicks generated through our advertising programs was due to certain monetization
expansion of our products, advertisers, and user base, as well as an increase in the number of Google Network Members,
22
GOOGLE INC.
PART II