Freeport-McMoRan 2009 Annual Report Download - page 2
Download and view the complete annual report
Please find page 2 of the 2009 Freeport-McMoRan annual report below. You can navigate through the pages in the report by either clicking on the pages listed below, or by using the keyword search tool below to find specific information within the annual report.-
 1
1 -
 2
2 -
 3
3 -
 4
4 -
 5
5 -
 6
6 -
 7
7 -
 8
8 -
 9
9 -
 10
10 -
 11
11 -
 12
12 -
 13
13 -
14
-
15
-
16
-
17
-
18
-
19
-
20
-
21
-
22
-
23
-
24
-
25
-
26
-
27
-
28
-
29
-
30
-
31
-
32
-
33
-
34
-
35
-
36
-
37
-
38
-
39
-
40
-
41
-
42
-
43
-
44
-
45
-
46
-
47
-
48
-
49
-
50
-
51
-
52
-
53
-
54
-
55
-
56
-
57
-
58
-
59
-
60
-
61
-
62
-
63
-
64
-
65
-
66
-
67
-
68
-
69
-
70
-
71
-
72
-
73
-
74
-
75
-
76
-
77
-
78
-
79
-
80
-
81
-
82
-
83
-
84
-
85
-
86
-
87
-
88
-
89
-
90
-
91
-
92
-
93
-
94
-
95
-
96
-
97
-
98
-
99
-
100
-
101
-
102
-
103
-
104
-
105
-
106
-
107
-
108
 |
 |

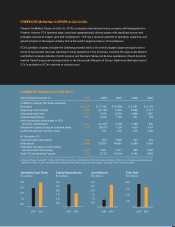
Freeport-McMoRan Copper & Gold Inc. (FCX) is a leading international mining company with headquarters in
Phoenix, Arizona. FCX operates large, long-lived, geographically diverse assets with signicant proven and
probable reserves of copper, gold and molybdenum. FCX has a dynamic portfolio of operating, expansion and
growth projects in the copper industry and is the world’s largest producer of molybdenum.
FCX’s portfolio of assets includes the Grasberg minerals district, the world’s largest copper and gold mine in
terms of recoverable reserves; signicant mining operations in the Americas, including the large-scale Morenci
and Safford minerals districts in North America and the Cerro Verde and El Abra operations in South America;
and the Tenke Fungurume minerals district in the Democratic Republic of Congo. Additional information about
FCX is available on FCX’s web site at www.fcx.com.
FREEPORT-McMoRan COPPER & GOLD INC.
Years Ended December 31, 2009 2008 2007 2006 2005
(In Millions, Except Per Share Amounts)
Revenues $ 15,040 $ 17,796 $ 16,939 $ 5,791 $ 4,179
Operating income (loss) 6,503 (12,710)+ 6,555 2,869 2,177
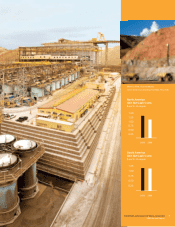
Operating cash ows 4,397 3,370 6,225 1,866 1,552
Capital expenditures 1,587 2,708 1,755 251 143
Net income (loss) attributable to FCX
common stockholders 2,527 (11,341)+ 2,769 1,396 935
Diluted net income (loss) per common share 5.86 (29.72)+ 7.50 6.63 4.67
Dividends paid per common share — 1.81 1.25 4.75 2.50
At December 31:
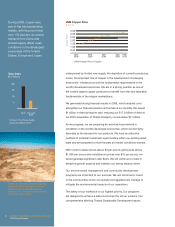
Cash and cash equivalents 2,656 872 1,626 907 764
Total assets 25,996 23,353 40,661 5,390 5,550
Total debt, including current portion
and short-term borrowings 6,346 7,351 7,211 680 1,256
Total FCX stockholders’ equity 9,119 5,773 18,234 2,445 1,843
* Includes charges totaling $17.7 billion ($13.2 billion to net loss attributable to FCX common stockholders or $34.47 per share) associated with asset
impairment, lower of cost or market inventory adjustments, restructuring and other charges. See page 14 for further discussion.
SUMMARY FINANCIAL HIGHLIGHTS
Operating Cash Flows
$ in billions
2.5
4.5
3.5
1.5
0.5
20092008
Capital Expenditures
$ in billions
1.5
2.0
3.0
2.5
1.0
0.5
20092008
Cash Balance
$ in billions
2.0
3.0
2.5
1.5
1.0
0.5
20092008
Total Debt
$ in billions
4.0
8.0
6.0
2.0
20092008
+