Federal Express 2011 Annual Report Download - page 10
Download and view the complete annual report
Please find page 10 of the 2011 Federal Express annual report below. You can navigate through the pages in the report by either clicking on the pages listed below, or by using the keyword search tool below to find specific information within the annual report.-
 1
1 -
 2
2 -
 3
3 -
 4
4 -
 5
5 -
 6
6 -
 7
7 -
 8
8 -
 9
9 -
 10
10 -
 11
11 -
 12
12 -
 13
13 -
 14
14 -
 15
15 -
 16
16 -
 17
17 -
 18
18 -
 19
19 -
 20
20 -
 21
21 -
22
-
23
-
24
-
25
-
26
-
27
-
28
-
29
-
30
-
31
-
32
-
33
-
34
-
35
-
36
-
37
-
38
-
39
-
40
-
41
-
42
-
43
-
44
-
45
-
46
-
47
-
48
-
49
-
50
-
51
-
52
-
53
-
54
-
55
-
56
-
57
-
58
-
59
-
60
-
61
-
62
-
63
-
64
-
65
-
66
-
67
-
68
-
69
-
70
-
71
-
72
-
73
-
74
-
75
-
76
-
77
-
78
-
79
-
80
 |
 |

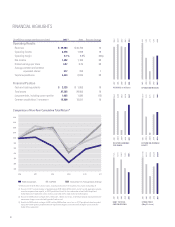
REVENUE (in billions)
2007
2008
2009
2010
2011
$35.2
$38.0
$35.5
$34.7
$39.3
8
Comparison of Five-Year Cumulative Total Return*
FINANCIAL HIGHLIGHTS
*$100 invested on 5/31/06 in stock or index, including reinvestment of dividends. Fiscal year ending May 31.
FedEx Corporation S&P 500 Dow Jones U.S. Transportation Average
5/06 5/07 5/08 5/09 5/10 5/11
$140
$130
$120
$110
$100
$90
$80
$70
$60
$50
$40
OPERATING MARGIN
2007
2008(3)
2009(2)
2010
2011(1)
9.3%
5.5%
2.1%
5.8%
6.1%
DILUTED EARNINGS
PER SHARE
2007
2008(3)
2009(2)
2010
2011
$6.48
$3.60
$0.31
$3.76
$4.57
RETURN ON AVERAGE
EQUITY
2007
2008(3)
2009(2)
2010
2011(1)
16.7%
8.3%
0.7%
8.6%
10.0%
DEBT TO TOTAL
CAPITALIZATION
2007
2008
2009
2010
2011
17.3%
12.1%
15.9%
12.3%
10.0%
STOCK PRICE
(May 31 close)
2007
2008
2009
2010
2011
$111.62
$91.71
$55.43
$83.49
$93.64
(in millions, except earnings per share) 2011(1) 2010 Percent Change
Operating Results
Revenues $ 39,304 $ 34,734 13
Operating income 2,378 1,998 19
Operating margin 6.1% 5.8% 30bp
Net income 1,452 1,184 23
Diluted earnings per share 4.57 3.76 22
Average common and common
equivalent shares 317 314 1
Capital expenditures 3,434 2,816 22
Financial Position
Cash and cash equivalents $ 2,328 $ 1,952 19
Total assets 27,385 24,902 10
Long-term debt, including current portion 1,685 1,930 (13)
Common stockholders’ investment 15,220 13,811 10
(1) Results for 2011 include charges of approximately $199 million ($104 million, net of tax and applicable variable
incentive compensation impacts, or $0.33 per diluted share) for the combination of our FedEx Freight and
FedEx National LTL operations and a reserve associated with a legal matter at FedEx Express.
(2) Results for 2009 include a charge of $1.2 billion ($1.1 billion, net of tax, or $3.45 per diluted share) primarily for
impairment charges associated with goodwill and aircraft.
(3) Results for 2008 include a charge of $891 million ($696 million, net of tax, or $2.23 per diluted share) recorded
during the fourth quarter, predominantly for impairment charges associated with intangible assets from the
FedEx Office acquisition.