Fannie Mae 2010 Annual Report Download - page 7
Download and view the complete annual report
Please find page 7 of the 2010 Fannie Mae annual report below. You can navigate through the pages in the report by either clicking on the pages listed below, or by using the keyword search tool below to find specific information within the annual report.-
 1
1 -
 2
2 -
 3
3 -
 4
4 -
 5
5 -
 6
6 -
 7
7 -
 8
8 -
 9
9 -
 10
10 -
 11
11 -
 12
12 -
 13
13 -
 14
14 -
 15
15 -
 16
16 -
 17
17 -
 18
18 -
19
-
20
-
21
-
22
-
23
-
24
-
25
-
26
-
27
-
28
-
29
-
30
-
31
-
32
-
33
-
34
-
35
-
36
-
37
-
38
-
39
-
40
-
41
-
42
-
43
-
44
-
45
-
46
-
47
-
48
-
49
-
50
-
51
-
52
-
53
-
54
-
55
-
56
-
57
-
58
-
59
-
60
-
61
-
62
-
63
-
64
-
65
-
66
-
67
-
68
-
69
-
70
-
71
-
72
-
73
-
74
-
75
-
76
-
77
-
78
-
79
-
80
-
81
-
82
-
83
-
84
-
85
-
86
-
87
-
88
-
89
-
90
-
91
-
92
-
93
-
94
-
95
-
96
-
97
-
98
-
99
-
100
-
101
-
102
-
103
-
104
-
105
-
106
-
107
-
108
-
109
-
110
-
111
-
112
-
113
-
114
-
115
-
116
-
117
-
118
-
119
-
120
-
121
-
122
-
123
-
124
-
125
-
126
-
127
-
128
-
129
-
130
-
131
-
132
-
133
-
134
-
135
-
136
-
137
-
138
-
139
-
140
-
141
-
142
-
143
-
144
-
145
-
146
-
147
-
148
-
149
-
150
-
151
-
152
-
153
-
154
-
155
-
156
-
157
-
158
-
159
-
160
-
161
-
162
-
163
-
164
-
165
-
166
-
167
-
168
-
169
-
170
-
171
-
172
-
173
-
174
-
175
-
176
-
177
-
178
-
179
-
180
-
181
-
182
-
183
-
184
-
185
-
186
-
187
-
188
-
189
-
190
-
191
-
192
-
193
-
194
-
195
-
196
-
197
-
198
-
199
-
200
-
201
-
202
-
203
-
204
-
205
-
206
-
207
-
208
-
209
-
210
-
211
-
212
-
213
-
214
-
215
-
216
-
217
-
218
-
219
-
220
-
221
-
222
-
223
-
224
-
225
-
226
-
227
-
228
-
229
-
230
-
231
-
232
-
233
-
234
-
235
-
236
-
237
-
238
-
239
-
240
-
241
-
242
-
243
-
244
-
245
-
246
-
247
-
248
-
249
-
250
-
251
-
252
-
253
-
254
-
255
-
256
-
257
-
258
-
259
-
260
-
261
-
262
-
263
-
264
-
265
-
266
-
267
-
268
-
269
-
270
-
271
-
272
-
273
-
274
-
275
-
276
-
277
-
278
-
279
-
280
-
281
-
282
-
283
-
284
-
285
-
286
-
287
-
288
-
289
-
290
-
291
-
292
-
293
-
294
-
295
-
296
-
297
-
298
-
299
-
300
-
301
-
302
-
303
-
304
-
305
-
306
-
307
-
308
-
309
-
310
-
311
-
312
-
313
-
314
-
315
-
316
-
317
-
318
-
319
-
320
-
321
-
322
-
323
-
324
-
325
-
326
-
327
-
328
-
329
-
330
-
331
-
332
-
333
-
334
-
335
-
336
-
337
-
338
-
339
-
340
-
341
-
342
-
343
-
344
-
345
-
346
-
347
-
348
-
349
-
350
-
351
-
352
-
353
-
354
-
355
-
356
-
357
-
358
-
359
-
360
-
361
-
362
-
363
-
364
-
365
-
366
-
367
-
368
-
369
-
370
-
371
-
372
-
373
-
374
-
375
-
376
-
377
-
378
-
379
-
380
-
381
-
382
-
383
-
384
-
385
-
386
-
387
-
388
-
389
-
390
-
391
-
392
-
393
-
394
-
395
-
396
-
397
-
398
-
399
-
400
-
401
-
402
-
403
 |
 |

Since our entry into conservatorship, we have entered into agreements with Treasury that include covenants
that significantly restrict our business activities and provide for substantial U.S. government financial support.
We provide additional information on the conservatorship, the provisions of our agreements with the Treasury,
and its impact on our business below under “Conservatorship and Treasury Agreements” and “Risk Factors.”
RESIDENTIAL MORTGAGE MARKET
The U.S. Residential Mortgage Market
We conduct business in the U.S. residential mortgage market and the global securities market. In response to
the financial crisis and severe economic recession that began in December 2007, the U.S. government took a
number of extraordinary measures designed to provide fiscal stimulus, improve liquidity and protect and
support the housing and financial markets. Examples of these measures include: (1) the Federal Reserve’s
temporary programs to purchase up to $1.25 trillion of GSE mortgage-backed securities and approximately
$175 billion of GSE debt by March 31, 2010, which were intended to provide support to mortgage lending
and the housing market and to improve overall conditions in private credit markets; (2) the Administration’s
Making Home Affordable Program, which was intended to stabilize the housing market by providing
assistance to homeowners and preventing foreclosures; and (3) the first-time and move-up homebuyer tax
credits, enacted to help increase home sales and stabilize home prices. The homebuyer tax credits were
available for qualifying home purchases by buyers who entered into binding contracts by April 30, 2010.
Total U.S. residential mortgage debt outstanding, which includes $10.6 trillion of single-family mortgage debt
outstanding, was estimated to be approximately $11.5 trillion as of September 30, 2010, the latest date for
which information was available, according to the Federal Reserve. After increasing every quarter since record
keeping began in 1952 until the second quarter of 2008, single-family mortgage debt outstanding has been
steadily declining since then. We owned or guaranteed mortgage assets representing approximately 27.4% of
total U.S. residential mortgage debt outstanding as of September 30, 2010.
We operate our business solely in the United States and its territories, and accordingly, we generate no revenue
from and have no assets in geographic locations other than the United States and its territories.
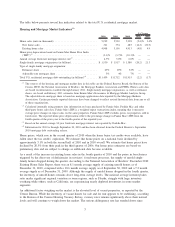
Housing and Mortgage Market and Economic Conditions
During the fourth quarter of 2010, the United States economic recovery continued. The U.S. gross domestic
product, or GDP, rose by 3.2% on an annualized basis during the quarter after adjusting for inflation,
according to the Bureau of Economic Analysis advance estimate. The overall economy gained an estimated
128,000 jobs in the fourth quarter, with the private sector continuing its recent trend of moderate employment
growth throughout the quarter and into January 2011. The unemployment rate was 9.0% in January 2011,
compared with 9.6% in September 2010, based on data from the U.S. Bureau of Labor Statistics.
Housing activity rebounded modestly in the fourth quarter of 2010 after experiencing a pullback in the third
quarter. For all of 2010, home sales declined for the fourth time in the past five years, despite low mortgage
rates, reduced home prices and the first-time and move-up homebuyer tax credits that increased existing home
sales earlier in the year. Weak demand for homes, a weak labor market, strengthened lending standards in the
industry and elevated vacancy and foreclosure rates are the main obstacles to the housing recovery. Total
existing home sales fell by 4.8% in 2010 from 2009, according to data available through January 2011. Faced
with fierce competition from distressed sales, new home sales fared significantly worse, dropping by 14.2% in
2010, according to data available through January 2011, and accounting for just 5.5% of total home sales in
the fourth quarter of 2010, down from a peak of more than 19% at the beginning of 2005. After four
consecutive years of double-digit declines to an annual record low, total housing starts rose a modest 5.9% in
2010.
2