Fannie Mae 2010 Annual Report Download - page 15
Download and view the complete annual report
Please find page 15 of the 2010 Fannie Mae annual report below. You can navigate through the pages in the report by either clicking on the pages listed below, or by using the keyword search tool below to find specific information within the annual report.-
 1
1 -
2
-
3
-
4
-
 5
5 -
 6
6 -
 7
7 -
 8
8 -
 9
9 -
 10
10 -
 11
11 -
 12
12 -
 13
13 -
 14
14 -
 15
15 -
 16
16 -
 17
17 -
 18
18 -
 19
19 -
 20
20 -
 21
21 -
 22
22 -
 23
23 -
 24
24 -
 25
25 -
26
-
27
-
28
-
29
-
30
-
31
-
32
-
33
-
34
-
35
-
36
-
37
-
38
-
39
-
40
-
41
-
42
-
43
-
44
-
45
-
46
-
47
-
48
-
49
-
50
-
51
-
52
-
53
-
54
-
55
-
56
-
57
-
58
-
59
-
60
-
61
-
62
-
63
-
64
-
65
-
66
-
67
-
68
-
69
-
70
-
71
-
72
-
73
-
74
-
75
-
76
-
77
-
78
-
79
-
80
-
81
-
82
-
83
-
84
-
85
-
86
-
87
-
88
-
89
-
90
-
91
-
92
-
93
-
94
-
95
-
96
-
97
-
98
-
99
-
100
-
101
-
102
-
103
-
104
-
105
-
106
-
107
-
108
-
109
-
110
-
111
-
112
-
113
-
114
-
115
-
116
-
117
-
118
-
119
-
120
-
121
-
122
-
123
-
124
-
125
-
126
-
127
-
128
-
129
-
130
-
131
-
132
-
133
-
134
-
135
-
136
-
137
-
138
-
139
-
140
-
141
-
142
-
143
-
144
-
145
-
146
-
147
-
148
-
149
-
150
-
151
-
152
-
153
-
154
-
155
-
156
-
157
-
158
-
159
-
160
-
161
-
162
-
163
-
164
-
165
-
166
-
167
-
168
-
169
-
170
-
171
-
172
-
173
-
174
-
175
-
176
-
177
-
178
-
179
-
180
-
181
-
182
-
183
-
184
-
185
-
186
-
187
-
188
-
189
-
190
-
191
-
192
-
193
-
194
-
195
-
196
-
197
-
198
-
199
-
200
-
201
-
202
-
203
-
204
-
205
-
206
-
207
-
208
-
209
-
210
-
211
-
212
-
213
-
214
-
215
-
216
-
217
-
218
-
219
-
220
-
221
-
222
-
223
-
224
-
225
-
226
-
227
-
228
-
229
-
230
-
231
-
232
-
233
-
234
-
235
-
236
-
237
-
238
-
239
-
240
-
241
-
242
-
243
-
244
-
245
-
246
-
247
-
248
-
249
-
250
-
251
-
252
-
253
-
254
-
255
-
256
-
257
-
258
-
259
-
260
-
261
-
262
-
263
-
264
-
265
-
266
-
267
-
268
-
269
-
270
-
271
-
272
-
273
-
274
-
275
-
276
-
277
-
278
-
279
-
280
-
281
-
282
-
283
-
284
-
285
-
286
-
287
-
288
-
289
-
290
-
291
-
292
-
293
-
294
-
295
-
296
-
297
-
298
-
299
-
300
-
301
-
302
-
303
-
304
-
305
-
306
-
307
-
308
-
309
-
310
-
311
-
312
-
313
-
314
-
315
-
316
-
317
-
318
-
319
-
320
-
321
-
322
-
323
-
324
-
325
-
326
-
327
-
328
-
329
-
330
-
331
-
332
-
333
-
334
-
335
-
336
-
337
-
338
-
339
-
340
-
341
-
342
-
343
-
344
-
345
-
346
-
347
-
348
-
349
-
350
-
351
-
352
-
353
-
354
-
355
-
356
-
357
-
358
-
359
-
360
-
361
-
362
-
363
-
364
-
365
-
366
-
367
-
368
-
369
-
370
-
371
-
372
-
373
-
374
-
375
-
376
-
377
-
378
-
379
-
380
-
381
-
382
-
383
-
384
-
385
-
386
-
387
-
388
-
389
-
390
-
391
-
392
-
393
-
394
-
395
-
396
-
397
-
398
-
399
-
400
-
401
-
402
-
403
 |
 |

which we discuss in more detail in “Table 3: Credit Profile of Single-Family Conventional Loans Acquired”
and in “Table 40: Risk Characteristics of Single-Family Conventional Business Volume and Guaranty Book of
Business.” These expectations are also based on numerous other assumptions, including our expectations
regarding home price declines set forth below in “Outlook.” As shown in Table 1, we expect loans we have
acquired in 2009 and 2010 to be profitable. If future macroeconomic conditions turn out to be significantly
more adverse than our expectations, these loans could become unprofitable. For example, we believe that these
loans would become unprofitable if home prices declined more than 20% from their December 2010 levels
over the next five years based on our home price index, which would be an approximately 36% decline from
their peak in the third quarter of 2006.
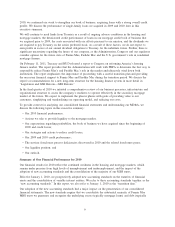
Table 1: Expected Lifetime Profitability of Single-Family Loans Acquired in 1991 through 2010
Acquisition Year Expectation for
Percentage of
Single-Family Guaranty
Book of Business
as of December 31, 2010
Profitability
1991 to 2000 Profitable
2001 Profitable
2002 Profitable
2003 Profitable
2004 Break-even
2005 Not Profitable
2006 Not Profitable
2007 Not Profitable
2008 Not Profitable
2009 Profitable
2010 Profitable
21%
39%
40%
As Table 1 shows, the key years in which we acquired loans that we expect will be unprofitable are 2005
through 2008, and the vast majority of our realized credit losses in 2009 and 2010 to date are attributable to
these loans. Loans we acquired in 2004 were originated under more conservative acquisition policies than
loans we acquired from 2005 through 2008; however, we expect them to perform close to break-even because
these loans were made as home prices were rapidly increasing and therefore suffered from the subsequent
decline in home prices.
Loans we have acquired since the beginning of 2009 comprised over 40% of our single-family guaranty book
of business as of December 31, 2010. Our 2005 to 2008 acquisitions are becoming a smaller percentage of our
guaranty book of business, having decreased from 50% of our guaranty book of business as of December 31,
2009 to 39% as of December 31, 2010.
10