Fannie Mae 2010 Annual Report Download - page 17
Download and view the complete annual report
Please find page 17 of the 2010 Fannie Mae annual report below. You can navigate through the pages in the report by either clicking on the pages listed below, or by using the keyword search tool below to find specific information within the annual report.-
 1
1 -
2
-
3
-
4
-
5
-
6
-
 7
7 -
 8
8 -
 9
9 -
 10
10 -
 11
11 -
 12
12 -
 13
13 -
 14
14 -
 15
15 -
 16
16 -
 17
17 -
 18
18 -
 19
19 -
 20
20 -
 21
21 -
 22
22 -
 23
23 -
 24
24 -
 25
25 -
 26
26 -
 27
27 -
28
-
29
-
30
-
31
-
32
-
33
-
34
-
35
-
36
-
37
-
38
-
39
-
40
-
41
-
42
-
43
-
44
-
45
-
46
-
47
-
48
-
49
-
50
-
51
-
52
-
53
-
54
-
55
-
56
-
57
-
58
-
59
-
60
-
61
-
62
-
63
-
64
-
65
-
66
-
67
-
68
-
69
-
70
-
71
-
72
-
73
-
74
-
75
-
76
-
77
-
78
-
79
-
80
-
81
-
82
-
83
-
84
-
85
-
86
-
87
-
88
-
89
-
90
-
91
-
92
-
93
-
94
-
95
-
96
-
97
-
98
-
99
-
100
-
101
-
102
-
103
-
104
-
105
-
106
-
107
-
108
-
109
-
110
-
111
-
112
-
113
-
114
-
115
-
116
-
117
-
118
-
119
-
120
-
121
-
122
-
123
-
124
-
125
-
126
-
127
-
128
-
129
-
130
-
131
-
132
-
133
-
134
-
135
-
136
-
137
-
138
-
139
-
140
-
141
-
142
-
143
-
144
-
145
-
146
-
147
-
148
-
149
-
150
-
151
-
152
-
153
-
154
-
155
-
156
-
157
-
158
-
159
-
160
-
161
-
162
-
163
-
164
-
165
-
166
-
167
-
168
-
169
-
170
-
171
-
172
-
173
-
174
-
175
-
176
-
177
-
178
-
179
-
180
-
181
-
182
-
183
-
184
-
185
-
186
-
187
-
188
-
189
-
190
-
191
-
192
-
193
-
194
-
195
-
196
-
197
-
198
-
199
-
200
-
201
-
202
-
203
-
204
-
205
-
206
-
207
-
208
-
209
-
210
-
211
-
212
-
213
-
214
-
215
-
216
-
217
-
218
-
219
-
220
-
221
-
222
-
223
-
224
-
225
-
226
-
227
-
228
-
229
-
230
-
231
-
232
-
233
-
234
-
235
-
236
-
237
-
238
-
239
-
240
-
241
-
242
-
243
-
244
-
245
-
246
-
247
-
248
-
249
-
250
-
251
-
252
-
253
-
254
-
255
-
256
-
257
-
258
-
259
-
260
-
261
-
262
-
263
-
264
-
265
-
266
-
267
-
268
-
269
-
270
-
271
-
272
-
273
-
274
-
275
-
276
-
277
-
278
-
279
-
280
-
281
-
282
-
283
-
284
-
285
-
286
-
287
-
288
-
289
-
290
-
291
-
292
-
293
-
294
-
295
-
296
-
297
-
298
-
299
-
300
-
301
-
302
-
303
-
304
-
305
-
306
-
307
-
308
-
309
-
310
-
311
-
312
-
313
-
314
-
315
-
316
-
317
-
318
-
319
-
320
-
321
-
322
-
323
-
324
-
325
-
326
-
327
-
328
-
329
-
330
-
331
-
332
-
333
-
334
-
335
-
336
-
337
-
338
-
339
-
340
-
341
-
342
-
343
-
344
-
345
-
346
-
347
-
348
-
349
-
350
-
351
-
352
-
353
-
354
-
355
-
356
-
357
-
358
-
359
-
360
-
361
-
362
-
363
-
364
-
365
-
366
-
367
-
368
-
369
-
370
-
371
-
372
-
373
-
374
-
375
-
376
-
377
-
378
-
379
-
380
-
381
-
382
-
383
-
384
-
385
-
386
-
387
-
388
-
389
-
390
-
391
-
392
-
393
-
394
-
395
-
396
-
397
-
398
-
399
-
400
-
401
-
402
-
403
 |
 |

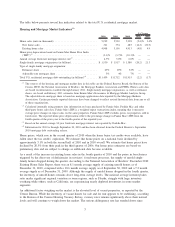
Table 2: Single-Family Serious Delinquency Rates by Year of Acquisition
Home Price
Appreciation(1) 6.3 % 7.5 % 7.6 % 10.7 % 11.5 % 2.7%
%%%%%%
(4.1) % (10.3) % (3.7) % (3.1) %
%%% %
Unemployment
rate 4.7 5.8 6.0 5.5 5.1 4.6 4.6 5.8 9.3 9.6
20092001 2002 2003 2004 2005 2006 2007 2008 2010
SDQ Rate
(2)
0.0%
0.8%
1.6%
2.4%
3.2%
4.0%
4.8%
5.6%
6.4%
7.2%
8.0%
8.8%
9.6%
10.4%
11.2%
12.0%
12.8%
13.6%
2001 2002 2003 2004 2005 2006 2007 2008 2009 *
SDQ Rate as of December 31, 2010
SDQ Rate as of end of 4th quarter following
acquisition year
* For 2009, the serious delinquency rate as of December 31, 2010 is the same as the serious delinquency rate as of the
end of the fourth quarter following the acquisition year.
(1)
Based on Fannie Mae’s HPI, which measures average price changes based on repeat sales on the same properties. For
2010, the data show an initial estimate based on purchase transactions in Fannie-Freddie acquisition and public deed
data available through the end of January 2011. Previously reported data has been revised to reflect additional
available historical data. Including subsequently available data may lead to materially different results.
(2)
Based on the average national unemployment rates for each month reported in the labor force statistics current
population survey (CPS), Bureau of Labor Statistics.
Credit Profile of Our Single-Family Acquisitions
Single-family loans we purchased or guaranteed from 2005 through 2008 were acquired during a period when
home prices were rising rapidly, peaked, and then started to decline sharply, and underwriting and eligibility
standards were more relaxed than they are now. These loans were characterized, on average and as discussed
below, by higher LTV ratios and lower FICO credit scores than loans we have acquired since January 1, 2009.
In addition, many of these loans were Alt-A loans or had other higher-risk loan attributes such as interest-only
payment features. As a result of the sharp declines in home prices, 29% of the loans that we acquired from
12