Exxon 2015 Annual Report Download - page 7
Download and view the complete annual report
Please find page 7 of the 2015 Exxon annual report below. You can navigate through the pages in the report by either clicking on the pages listed below, or by using the keyword search tool below to find specific information within the annual report.-
 1
1 -
 2
2 -
 3
3 -
 4
4 -
 5
5 -
 6
6 -
 7
7 -
 8
8 -
 9
9 -
 10
10 -
 11
11 -
 12
12 -
 13
13 -
 14
14 -
 15
15 -
 16
16 -
 17
17 -
 18
18 -
19
-
20
-
21
-
22
-
23
-
24
-
25
-
26
-
27
-
28
-
29
-
30
-
31
-
32
-
33
-
34
-
35
-
36
-
37
-
38
-
39
-
40
-
41
-
42
-
43
-
44
-
45
-
46
-
47
-
48
-
49
-
50
-
51
-
52
 |
 |

Financial Highlights
(millions of dollars, unless noted)
Earnings after
Income Taxes
Average
Capital
Employed
(2)
Return on
Average Capital
Employed (%)
(2)
Capital and
Exploration
Expenditures
(2)
Upstream 7,101 169,954 4.2 25,407
Downstream 6,557 23,253 28.2 2,613
Chemical 4,418 23,750 18.6 2,843
Corporate and Financing (1,926)(8,202)N.A. 188
Total 16,150 208,755 7.9 31,051
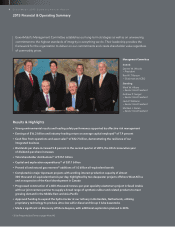
Operating Highlights
Liquids production (net, thousands of barrels per day) 2,345
Natural gas production available for sale (net, millions of cubic feet per day) 10,515
Oil-equivalent production
(7)
(net, thousands of oil-equivalent barrels per day) 4,097
Refinery throughput (thousands of barrels per day) 4,432
Petroleum product sales (thousands of barrels per day) 5,754
Chemical prime product sales
(2)
(thousands of tonnes) 24,713
50
40
30
20
10
0
–3
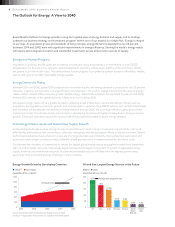
Functional Earnings and Net Income(1)
(billions of dollars)
Upstream Downstream Chemical Corporate
and Financing
Net
Income(1)
2011 201520132012 2014
Eric Whetstone • Whetstone Design
EDITOR
Clark Fertitta • Investor Relations
Exxon Mobil Corporation, Irving, TX
Carol Zuber-Mallison • ZM Graphics, Inc.
studio/cell: 214-906-4162 • fax: 817-924-7784
APPROVED BY
Feb. 26, 2016
LAST FILE CHANGE MADE BY
S05A 15XOM-
FuncEarnings.ai
IN F&O ON PAGE
IN SAR ON PAGE
Eric Whetstone • Whetstone Design
EDITOR
Clark Fertitta • Investor Relations
Exxon Mobil Corporation, Irving, TX
Carol Zuber-Mallison • ZM Graphics, Inc.
studio/cell: 214-906-4162 • fax: 817-924-7784
ATTENTION: OWNER VERSION
APPROVED BY
Feb. 18, 2016
FILE INFO
LAST FILE CHANGE MADE BY
C S05B 15XOM-
ROCE.ai
IN F&O ON PAGE
IN SAR ON PAGE
Includes link file
20
15
10
5
0
–5
Return on Average Capital Employed(2)(3)
ExxonMobil ShellChevron BPTotal
(percent)
2015 2011–2015 Average
3.00
2.50
2.00
1.50
1.00
0.50
01995 20051982
(dollars per share)
ExxonMobil S&P 500 Consumer Price Index(5)
Eric Whetstone • Whetstone Design
EDITOR
Clark Fertitta • Investor Relations
Exxon Mobil Corporation, Irving, TX
Carol Zuber-Mallison • ZM Graphics, Inc.
studio/cell: 214-906-4162 • fax: 817-924-7784
ATTENTION: OWNER VERSION
APPROVED BY
Feb. 18, 2016
FILE INFO
LAST FILE CHANGE MADE BY
C S05C 15XOM-
DividendGrowth.ai
IN F&O ON PAGE
IN SAR ON PAGE
Includes link file
2015
33rd Consecutive Year of Dividend Growth(4)
Eric Whetstone • Whetstone Design
EDITOR
Clark Fertitta • Investor Relations
Exxon Mobil Corporation, Irving, TX
Carol Zuber-Mallison • ZM Graphics, Inc.
studio/cell: 214-906-4162 • fax: 817-924-7784
ATTENTION: OWNER VERSION
APPROVED BY
Feb. 18, 2016
FILE INFO
LAST FILE CHANGE MADE BY
C S05D 15XOM-
ShrholdrReturns.ai
IN F&O ON PAGE
IN SAR ON PAGE
Includes link file
Total Shareholder Returns(2)
(percent per year)
ExxonMobil S&P 500Integrated Oil Competitor Average(6)
20 Years10 Years5 Years3 Years
15
10
5
0
–5
Eric Whetstone • Whetstone Design
EDITOR
Clark Fertitta • Investor Relations
Exxon Mobil Corporation, Irving, TX
Carol Zuber-Mallison • ZM Graphics, Inc.
studio/cell: 214-906-4162 • fax: 817-924-7784
ATTENTION: OWNER VERSION
APPROVED BY
Feb. 18, 2016
FILE INFO
LAST FILE CHANGE MADE BY
C S05C 15XOM-
DividendGrowth.ai
IN F&O ON PAGE
IN SAR ON PAGE
Includes link file
33rd Consecutive Year of Dividend Growt
(1) Net income attributable to ExxonMobil.
(2) See Frequently Used Terms on pages 44 and 45.
(3) Competitor data estimated on a consistent basis with ExxonMobil and based on public information.
(4) S&P 500 and CPI indexed to 1982 Exxon dividend.
(5) CPI based on historical yearly average from the U.S. Bureau of Labor Statistics.
(6) BP, Chevron, Royal Dutch Shell, and Total. Competitor data estimated on a consistent basis with ExxonMobil and based on public information.
(7) Natural gas converted to oil-equivalent at 6 million cubic feet per 1 thousand barrels.
5