Exxon 2015 Annual Report Download - page 2
Download and view the complete annual report
Please find page 2 of the 2015 Exxon annual report below. You can navigate through the pages in the report by either clicking on the pages listed below, or by using the keyword search tool below to find specific information within the annual report.-
 1
1 -
 2
2 -
 3
3 -
 4
4 -
 5
5 -
 6
6 -
 7
7 -
 8
8 -
 9
9 -
 10
10 -
 11
11 -
 12
12 -
 13
13 -
14
-
15
-
16
-
17
-
18
-
19
-
20
-
21
-
22
-
23
-
24
-
25
-
26
-
27
-
28
-
29
-
30
-
31
-
32
-
33
-
34
-
35
-
36
-
37
-
38
-
39
-
40
-
41
-
42
-
43
-
44
-
45
-
46
-
47
-
48
-
49
-
50
-
51
-
52
 |
 |

Statements of future events or conditions in this report, including projections, targets, expectations, estimates, and business plans, are
forward-looking statements. Actual future financial and operating results, including demand growth and energy mix; capacity growth;
the impact of new technologies; capital expenditures; production growth; project plans, dates, costs, and capacities; resource additions,
production rates, and resource recoveries; efficiency gains; cost savings; and product sales could differ materially due to, for example,
changes in oil and gas prices or other market conditions affecting the oil and gas industry; reservoir performance; timely completion of
development projects; war and other political or security disturbances; changes in law or government regulation, including environmental
regulations and political sanctions; the actions of competitors and customers; unexpected technological developments; general economic
conditions, including the occurrence and duration of economic recessions; the outcome of commercial negotiations; the impact of fiscal
and commercial terms; unforeseen technical difficulties; unanticipated operational disruptions; and other factors discussed in this
report and in Item 1A of ExxonMobil’s most recent Form 10-K.
Definitions of “resources” and “resource base,” as well as certain financial and operating measures and other terms used in this report,
are contained in the section titled “Frequently Used Terms” on pages 44 and 45. In the case of financial measures, such as “Return on
Average Capital Employed” and “Free Cash Flow,” the definitions also include information required by SEC Regulation G.
“Factors Affecting Future Results” and “Frequently Used Terms” are also available on the “Investors” section of our website.
Prior years’ data have been reclassified in certain cases to conform to the 2015 presentation basis.
The term “project” as used in this publication can refer to a variety of different activities and does not necessarily have the same meaning
as in any government payment transparency reports.
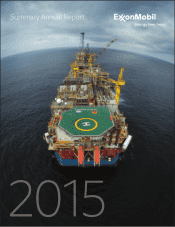
COVER PHOTO: The Kizomba B floating production, storage,
and offloading (FPSO) vessel offshore Angola has a production
capacity of 270 thousand oil-equivalent barrels per day and
can store 2.2 million barrels of oil at one time.
2 To Our Shareholders
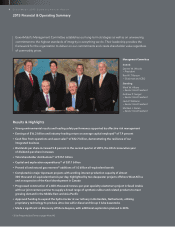
4 2015 Financial & Operating Summary
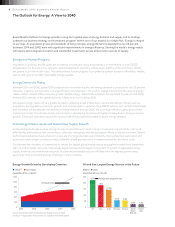
6 The Outlook for Energy
8 Operational Excellence
12 Upstream: Capital-Efficient Resource Developments
16 Upstream: Unlocking Resource Value
20 Downstream: Growing the Advantage
24 Chemical: Progressing Strategic Investments
28 Global Operations
30 Upstream
32 Downstream
34 Chemical
36 Corporate Citizenship
39 Financial Information
44 Frequently Used Terms
46 Board of Directors, Officers, and Affiliated Companies
48 Investor Information
49 General Information