Exxon 2014 Annual Report Download - page 7
Download and view the complete annual report
Please find page 7 of the 2014 Exxon annual report below. You can navigate through the pages in the report by either clicking on the pages listed below, or by using the keyword search tool below to find specific information within the annual report.-
 1
1 -
 2
2 -
 3
3 -
 4
4 -
 5
5 -
 6
6 -
 7
7 -
 8
8 -
 9
9 -
 10
10 -
 11
11 -
 12
12 -
 13
13 -
 14
14 -
 15
15 -
 16
16 -
 17
17 -
 18
18 -
19
-
20
-
21
-
22
-
23
-
24
-
25
-
26
-
27
-
28
-
29
-
30
-
31
-
32
-
33
-
34
-
35
-
36
-
37
-
38
-
39
-
40
-
41
-
42
-
43
-
44
-
45
-
46
-
47
-
48
-
49
-
50
-
51
-
52
 |
 |

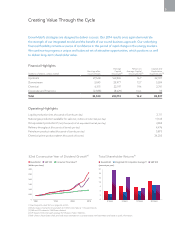
Financial Highlights
(millions of dollars, unless noted)
Earnings after
Income Taxes
Average
Capital
Employed
(1)
Return on
Average Capital
Employed (%)
(1)
Capital and
Exploration
Expenditures
(1)
Upstream 2 7, 5 4 8 164,965 16.7 32,727
Downstream 3,045 23,977 12.7 3,034
Chemical 4,315 22,197 19.4 2,741
Corporate and Financing (2,388)(8,029)N.A. 35
Total 32,520 203,110 16.2 38,537
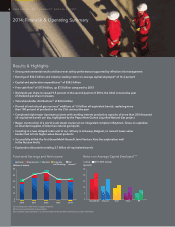
Operating Highlights
Liquids production (net, thousands of barrels per day) 2,111
Natural gas production available for sale (net, millions of cubic feet per day) 11,145
Oil-equivalent production
(2)
(net, thousands of oil-equivalent barrels per day) 3,969
Refinery throughput (thousands of barrels per day) 4,476
Petroleum product sales (thousands of barrels per day) 5,875
Chemical prime product sales
(1)
(thousands of tonnes) 24,235
32nd Consecutive Year of Dividend Growth(3)
(dollars per share)
ExxonMobil S&P 500 Consumer Price Index(4)
(1) See Frequently Used Terms on pages 44 and 45.
(2) Natural gas converted to oil-equivalent at 6 million cubic feet per 1 thousand barrels.
(3) S&P and CPI indexed to 1982 Exxon dividend.
(4) CPI based on historical yearly average from Bureau of Labor Statistics.
(5) BP, Chevron, Royal Dutch Shell, and Total values estimated on a consistent basis with ExxonMobil and based on public information.
Eric Whetstone • Whetstone Design
EDITOR
Nick Berthiaux • Investor Relations
Exxon Mobil Corporation, Irving, TX
Carol Zuber-Mallison • ZM Graphics, Inc.
studio/cell: 214-906-4162 • fax: 817-924-7784
ATTENTION: OWNER VERSION
APPROVED BY
Feb. 10, 2015
FILE INFO
LAST FILE CHANGE MADE BY
C S05A 14XOM-
DividendGrowth.ai
IN F&O ON PAGE
IN SAR ON PAGE
Includes link file
3.00
2.50
2.00
1.50
1.00
0.50
01994 20041982
2014
21
18
15
12
9
6
3
0
Total Shareholder Returns(1)
(percent per year)
ExxonMobil S&P 500Integrated Oil Competitor Average(5)
20 Years
10 Years5 Years3 Years
Eric Whetstone • Whetstone Design
EDITOR
Nick Berthiaux • Investor Relations
Exxon Mobil Corporation, Irving, TX
Carol Zuber-Mallison • ZM Graphics, Inc.
studio/cell: 214-906-4162 • fax: 817-924-7784
ATTENTION: OWNER VERSION
APPROVED BY
Feb. 10, 2015
FILE INFO
LAST FILE CHANGE MADE BY
C S05B 14XOM-
ShrhldrReturns.ai
IN F&O ON PAGE
IN SAR ON PAGE
Includes link file
ExxonMobil’s strategies are designed to deliver success. Our 2014 results once again demonstrate
the strength of our integrated model and the benefit of our sound business approach. Our underlying
financial flexibility remains a source of confidence in this period of rapid change in the energy markets.
We continue to progress a unique and balanced set of attractive opportunities, which positions us well
to deliver long-term shareholder value.
Creating Value Through the Cycle
5