Exxon 2007 Annual Report Download - page 7
Download and view the complete annual report
Please find page 7 of the 2007 Exxon annual report below. You can navigate through the pages in the report by either clicking on the pages listed below, or by using the keyword search tool below to find specific information within the annual report.-
 1
1 -
 2
2 -
 3
3 -
 4
4 -
 5
5 -
 6
6 -
 7
7 -
 8
8 -
 9
9 -
 10
10 -
 11
11 -
 12
12 -
 13
13 -
 14
14 -
 15
15 -
 16
16 -
 17
17 -
 18
18 -
19
-
20
-
21
-
22
-
23
-
24
-
25
-
26
-
27
-
28
-
29
-
30
-
31
-
32
-
33
-
34
-
35
-
36
-
37
-
38
-
39
-
40
-
41
-
42
-
43
-
44
-
45
-
46
-
47
-
48
-
49
-
50
-
51
-
52
 |
 |

2003 2004 2005 2006 2007
50
40
30
20
10
0
Functional Earnings and Net Income
Record Earnings in 2007
(billions of dollars)
Upstream Downstream Chemical Corporate
and Financing
Net
Income
– 2
ExxonMobil S&P 500 Integrated Oil Competitor Data(2)
10 Years
Total Shareholder Returns (1)
(percent per year)
(1) Reflects data through December 31, 2007.
(2) Royal Dutch Shell, BP, and Chevron values are calculated on a consistent basis
with ExxonMobil, based on public information.
5 Years 20 Years
25
20
15
10
5
Industry-Leading
Returns
Superior
Cash Flow
Operational
Excellence
GROWTH IN
SHAREHOLDER
VALUE
Disciplined
Investment
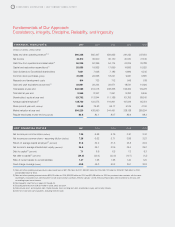
Superior 2007 Results
•
Best-ever lost-time incident rate for our combined employee and contractor workforce
•
Record earnings of $40.6 billion, with record performance in each of our business functions
•
Annual dividend per share growth of 7 percent versus 2006, the 25th consecutive year of dividend per share increases
•
Total shareholder distributions of $35.6 billion, an increase of $3 billion versus 2006
•
Industry-leading return on average capital employed of 32 percent
•
Start-up of seven major Upstream projects
•
Total liquids production and natural gas production available for sale of 4.2 million oil-equivalent barrels per day
•
Replaced 101 percent of production with proved oil and gas reserve additions of 1.6 billion oil-equivalent barrels,
including asset sales and the effect of the Venezuela expropriation, and excluding year-end price/cost effects
•
Downstream and Chemical operating cost efficiencies and margin enhancements totaling $2 billion after tax
BUSINE S S M ODEL
ExxonMobil has a consistent and straightforward business model that
combines our long-term perspective, disciplined approach to capital
investment, and focus on operational excellence to grow shareholder
value. We identify, develop, and execute projects using best practices
that ensure project returns will be resilient over a range of economic
scenarios. We operate our facilities using proven management systems
to achieve operational excellence. As a result, we are able to generate
more income from a highly efficient capital base, as demonstrated by
our superior return on capital employed. Our successful execution of
this model delivers industry-leading financial and operating results that
grow shareholder value.
ExxonMobil’s superior performance demonstrates
the strength of our long-term business model.
G ROW T H IN
S H A R E H O LD E R
VA L U E
E X X O N M O B I L C O R P O R A T I O N • 2 0 0 7 S U M M A R Y A N N U A L R E P O R T 5