Expedia 2007 Annual Report Download - page 4
Download and view the complete annual report
Please find page 4 of the 2007 Expedia annual report below. You can navigate through the pages in the report by either clicking on the pages listed below, or by using the keyword search tool below to find specific information within the annual report.-
 1
1 -
 2
2 -
 3
3 -
 4
4 -
 5
5 -
 6
6 -
 7
7 -
 8
8 -
 9
9 -
 10
10 -
 11
11 -
 12
12 -
 13
13 -
 14
14 -
 15
15 -
16
-
17
-
18
-
19
-
20
-
21
-
22
-
23
-
24
-
25
-
26
-
27
-
28
-
29
-
30
-
31
-
32
-
33
-
34
-
35
-
36
-
37
-
38
-
39
-
40
-
41
-
42
-
43
-
44
-
45
-
46
-
47
-
48
-
49
-
50
-
51
-
52
-
53
-
54
-
55
-
56
-
57
-
58
-
59
-
60
-
61
-
62
-
63
-
64
-
65
-
66
-
67
-
68
-
69
-
70
-
71
-
72
-
73
-
74
-
75
-
76
-
77
-
78
-
79
-
80
-
81
-
82
-
83
-
84
-
85
-
86
-
87
-
88
-
89
-
90
-
91
-
92
-
93
-
94
-
95
-
96
-
97
-
98
-
99
-
100
-
101
-
102
-
103
-
104
-
105
-
106
-
107
-
108
-
109
-
110
-
111
-
112
-
113
-
114
-
115
-
116
-
117
-
118
-
119
-
120
 |
 |

tourist attractions and travel agents — including Expedia and our competitors — access to millions of engaged
travelers.
The more subtle — but equally important — part of our advertising strategy is taking place at our
worldwide points of sale. While Expedia, Hotels.com and their international counterparts are rightly focused
on doing everything they can to improve conversion of shoppers into buyers, we are also seeking to do a much
better job monetizing the 90+% of travelers (tens of millions per month!) who visit our sites but don’t end up
purchasing from us for one reason or another.
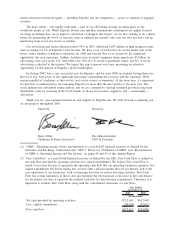
Our advertising and media businesses grew 93% in 2007, delivering $183 million in high margin revenue
and accounting for 7% of Expedia’s total revenue. We have a ton of work left to do on the media side of the
house, with a number of initiatives underway for 2008 and beyond. But we’re excited by the significant
opportunity this area represents. Airlines, hoteliers and car rental companies alone spend over $5 billion on
advertising every year in the U.S. And while over 50% of U.S. travel is purchased online, just 8% of travel
advertising is directed to the internet. We expect this gap to narrow over time, presenting an attractive
opportunity for this portion of Expedia’s global marketplace.
In closing, 2007 was a very successful year for Expedia, and we enter 2008 on sounder footing than ever.
But we’re also well aware of the significant uncertainty surrounding the economy and the consumer. We’ll
remain mindful of conditions as they evolve, and course correct as warranted. At the same time, it’s important
for investors to understand we are managing Expedia for more than the next quarter or the next year. The
travel industry has substantial online runway, and we are committed to driving sustained growth in long-term
shareholder value by investing in the travel brands of choice for travelers, suppliers, and — increasingly —
advertisers.
Thank you for your continued interest in, and support of, Expedia, Inc. We look forward to updating you
on our progress throughout 2008.
Sincerely, Sincerely,
Barry Diller
Chairman & Senior Executive
Dara Khosrowshahi
CEO & President
(1) “OIBA” (Operating income before amortization), is a non-GAAP financial measure as defined by the
Securities and Exchange Commission (the “SEC”). Please see “Definition of OIBA” and “Reconciliation
of OIBA to Operating Income and Net Income” on pages 44 and 45 of this Annual Report.
(2) “Free Cash Flow” is a non-GAAP financial measure as defined by the SEC. Free Cash Flow is defined as
net cash flow provided by operating activities less capital expenditures. We believe Free Cash Flow is
useful to investors because it represents the operating cash flow that our operating businesses generate, less
capital expenditures but before taking into account other cash movements that are not directly tied to the
core operations of our businesses, such as financing activities or certain investing activities. Free Cash
Flow has certain limitations in that it does not represent the total increase or decrease in the cash balance
for the period, nor does it represent the residual cash flow for discretionary expenditures. Therefore, it is
important to evaluate Free Cash Flow along with the consolidated statements of cash flows.
2007 2006
Year Ended
December 31,
(In thousands)
Net cash provided by operating activities ........................... $712,069 $617,440
Less: capital expenditures ...................................... (86,658) (92,631)
Free cash flow............................................... $625,411 $524,809