Eversource 2015 Annual Report Download - page 2
Download and view the complete annual report
Please find page 2 of the 2015 Eversource annual report below. You can navigate through the pages in the report by either clicking on the pages listed below, or by using the keyword search tool below to find specific information within the annual report.-
 1
1 -
 2
2 -
 3
3 -
 4
4 -
 5
5 -
 6
6 -
 7
7 -
 8
8 -
 9
9 -
 10
10 -
 11
11 -
 12
12 -
 13
13 -
14
-
15
-
16
-
17
-
18
-
19
-
20
-
21
-
22
-
23
-
24
-
25
-
26
-
27
-
28
-
29
-
30
-
31
-
32
-
33
-
34
-
35
-
36
-
37
-
38
-
39
-
40
-
41
-
42
-
43
-
44
-
45
-
46
-
47
-
48
-
49
-
50
-
51
-
52
-
53
-
54
-
55
-
56
-
57
-
58
-
59
-
60
-
61
-
62
-
63
-
64
-
65
-
66
-
67
-
68
-
69
-
70
-
71
-
72
-
73
-
74
-
75
-
76
-
77
-
78
-
79
-
80
-
81
-
82
-
83
-
84
-
85
-
86
-
87
-
88
-
89
-
90
-
91
-
92
-
93
-
94
-
95
-
96
-
97
-
98
-
99
-
100
-
101
-
102
-
103
-
104
-
105
-
106
-
107
-
108
-
109
-
110
-
111
-
112
-
113
-
114
-
115
-
116
-
117
-
118
-
119
-
120
-
121
-
122
-
123
-
124
-
125
-
126
-
127
-
128
-
129
-
130
-
131
-
132
-
133
-
134
-
135
-
136
 |
 |

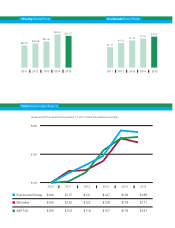
Total Shareholder Return
Closing Share Price Dividends Paid/Share
2011 2012 2013 2014 2015
$100
$150
$200
2010 2011 2012 2013 2014 2015
Eversource Energy $100 $117 $131 $147 $192 $189
EEI Index $100 $120 $122 $138 $178 $171
S&P 500 $100 $102 $118 $157 $178 $181
$36.07 $39.08 $42.39
$53.52 $51.07
2011 2012 2013 2014 2015
$1.10
$1.32
$1.47 $1.57 $1.67
(Assumes $100 invested on December 31, 2010 with all dividends reinvested)