Eversource 2015 Annual Report Download - page 15
Download and view the complete annual report
Please find page 15 of the 2015 Eversource annual report below. You can navigate through the pages in the report by either clicking on the pages listed below, or by using the keyword search tool below to find specific information within the annual report.-
 1
1 -
2
-
3
-
4
-
 5
5 -
 6
6 -
 7
7 -
 8
8 -
 9
9 -
 10
10 -
 11
11 -
 12
12 -
 13
13 -
 14
14 -
 15
15 -
 16
16 -
 17
17 -
 18
18 -
 19
19 -
 20
20 -
 21
21 -
 22
22 -
 23
23 -
 24
24 -
 25
25 -
26
-
27
-
28
-
29
-
30
-
31
-
32
-
33
-
34
-
35
-
36
-
37
-
38
-
39
-
40
-
41
-
42
-
43
-
44
-
45
-
46
-
47
-
48
-
49
-
50
-
51
-
52
-
53
-
54
-
55
-
56
-
57
-
58
-
59
-
60
-
61
-
62
-
63
-
64
-
65
-
66
-
67
-
68
-
69
-
70
-
71
-
72
-
73
-
74
-
75
-
76
-
77
-
78
-
79
-
80
-
81
-
82
-
83
-
84
-
85
-
86
-
87
-
88
-
89
-
90
-
91
-
92
-
93
-
94
-
95
-
96
-
97
-
98
-
99
-
100
-
101
-
102
-
103
-
104
-
105
-
106
-
107
-
108
-
109
-
110
-
111
-
112
-
113
-
114
-
115
-
116
-
117
-
118
-
119
-
120
-
121
-
122
-
123
-
124
-
125
-
126
-
127
-
128
-
129
-
130
-
131
-
132
-
133
-
134
-
135
-
136
 |
 |

3
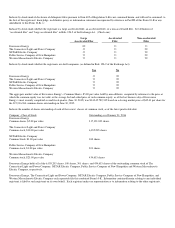
A summary of our distribution companies’ retail electric GWh sales volumes and percentage changes for 2015, as compared to 2014, is as follows:
2015 2014
Percentage
Change
Residential 21,441
21,317 0.6 %
Commercial 27,598
27,449 0.5 %
Industrial 5,577
5,676 (1.7)%
Total 54,616
54,442 0.3 %
Our 2015 consolidated retail electric sales volumes were slightly higher, as compared to 2014, due primarily to the impact of colder winter weather
experienced in the first quarter of 2015 and warmer weather in the third quarter of 2015, partially offset by milder winter weather in the fourth
quarter of 2015 throughout our service territories as well as an increase in customer conservation efforts, including the impact of energy efficiency
programs sponsored by CL&P, NSTAR Electric, PSNH and WMECO.
Fluctuations in retail electric sales volumes at NSTAR Electric and PSNH impact earnings. For CL&P (effective December 1, 2014) and WMECO,
fluctuations in retail electric sales volumes do not impact earnings due to their respective regulatory commission approved revenue decoupling
mechanisms. These distribution revenues are decoupled from their customer sales volumes, which breaks the relationship between sales volumes and
revenues recognized. CL&P and WMECO reconcile their annual base distribution rate recovery amounts to their respective pre-established levels of
baseline distribution delivery service revenues. Any difference between the allowed level of distribution revenue and the actual amount incurred
during a 12-month period is adjusted through rates in the following period.
ELECTRIC DISTRIBUTION – CONNECTICUT
THE CONNECTICUT LIGHT AND POWER COMPANY
CL&P’s distribution business consists primarily of the purchase, delivery and sale of electricity to its residential, commercial and industrial
customers. As of December 31, 2015, CL&P furnished retail franchise electric service to approximately 1.2 million customers in 149 cities and
towns in Connecticut, covering an area of 4,400 square miles. CL&P does not own any electric generation facilities.
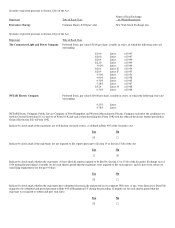
The following table shows the sources of CL&P’s 2015 electric franchise retail revenues based on categories of customers:
CL&P
(Thousands of Dollars, except percentages) 2015
% of Total
Residential
$
1,641,165 61
Commercial
841,093 31
Industrial
129,544 5
Other
62,704 3
Total Retail Electric Revenues
$
2,674,506 100%
A summary of CL&P’s retail electric GWh sales volumes and percentage changes for 2015, as compared to 2014, is as follows:
2015 2014
Percentage
Change
Residential 10,094
10,026 0.7 %
Commercial 9,635
9,643 (0.1)%
Industrial 2,342
2,377 (1.5)%
Total 22,071
22,046 0.1 %
Rates
CL&P is subject to regulation by the PURA, which, among other things, has jurisdiction over rates, certain dispositions of property and plant,
mergers and consolidations, issuances of long-term securities, standards of service and construction and operation of facilities. CL&P’s present
general rate structure consists of various rate and service classifications covering residential, commercial and industrial services. CL&P’s retail rates
include a delivery service component, which includes distribution, transmission, conservation, renewables, CTA, SBC and other charges that are
assessed on all customers. Connecticut utilities are entitled under state law to charge rates that are sufficient to allow them an opportunity to recover
their reasonable operating and capital costs, in order to attract needed capital and maintain their financial integrity, while also protecting relevant
public interests.
Under Connecticut law, all of CL&P’s customers are entitled to choose their energy suppliers, while CL&P remains their electric distribution
company. For those customers who do not choose a competitive energy supplier, under SS rates for customers with less than 500 kilowatts of
demand, and LRS rates for customers with 500 kilowatts or more of demand, CL&P purchases power under standard offer contracts and passes the
cost of the power to customers through a combined GSC and FMCC charge on customers’ bills.
CL&P continues to supply approximately 40 percent of its customer load at SS or LRS rates while the other 60 percent of its customer load has
migrated to competitive energy suppliers. Because this customer migration is only for energy supply service, it has no impact on CL&P’s electric
distribution business or its operating income.