Eversource 2014 Annual Report Download - page 17
Download and view the complete annual report
Please find page 17 of the 2014 Eversource annual report below. You can navigate through the pages in the report by either clicking on the pages listed below, or by using the keyword search tool below to find specific information within the annual report.-
 1
1 -
2
-
3
-
4
-
5
-
6
-
 7
7 -
 8
8 -
 9
9 -
 10
10 -
 11
11 -
 12
12 -
 13
13 -
 14
14 -
 15
15 -
 16
16 -
 17
17 -
 18
18 -
 19
19 -
 20
20 -
 21
21 -
 22
22 -
 23
23 -
 24
24 -
 25
25 -
 26
26 -
 27
27 -
28
-
29
-
30
-
31
-
32
-
33
-
34
-
35
-
36
-
37
-
38
-
39
-
40
-
41
-
42
-
43
-
44
-
45
-
46
-
47
-
48
-
49
-
50
-
51
-
52
-
53
-
54
-
55
-
56
-
57
-
58
-
59
-
60
-
61
-
62
-
63
-
64
-
65
-
66
-
67
-
68
-
69
-
70
-
71
-
72
-
73
-
74
-
75
-
76
-
77
-
78
-
79
-
80
-
81
-
82
-
83
-
84
-
85
-
86
-
87
-
88
-
89
-
90
-
91
-
92
-
93
-
94
-
95
-
96
-
97
-
98
-
99
-
100
-
101
-
102
-
103
-
104
-
105
-
106
-
107
-
108
-
109
-
110
-
111
-
112
-
113
-
114
-
115
-
116
-
117
-
118
-
119
-
120
-
121
-
122
-
123
-
124
-
125
-
126
-
127
-
128
-
129
-
130
-
131
-
132
-
133
-
134
-
135
-
136
 |
 |

5
the SS loads through a self-managed process that includes bilateral purchases and spot market purchases. CL&P typically enters into full
requirements contracts for LRS for larger commercial and industrial customers every three months. Currently, CL&P has full requirements contracts
in place for 80 percent of its SS loads for the first half of 2015 and has bilateral purchases in place to self-manage the remaining 20 percent. For the
second half of 2015, CL&P has 50 percent of its SS load under full requirements contracts, intends to purchase an additional 20 to 30 percent of full
requirements and will self-manage the remainder as needed. None of the SS load for 2016 has been procured. CL&P has full requirements contracts
in place for its LRS loads through the second quarter of 2015 and intends to purchase 100 percent of full requirements for the third and fourth
quarters of 2015.
ELECTRIC DISTRIBUTION –MASSACHUSETTS
NSTAR ELECTRIC COMPANY
WESTERN MASSACHUSETTS ELECTRIC COMPANY
The electric distribution businesses of NSTAR Electric and WMECO consist primarily of the purchase, delivery and sale of electricity to residential,
commercial and industrial customers within their respective franchise service territories. As of December 31, 2014, NSTAR Electric furnished retail
franchise electric service to approximately 1.2 million customers in Boston and 80 surrounding cities and towns in Massachusetts, including Cape
Cod and Martha's Vineyard, covering an area of approximately 1,700 square miles. WMECO provides retail franchise electric service to
approximately 208,000 customers in 59 cities and towns in the western region of Massachusetts, covering an area of approximately 1,500 square
miles. Neither NSTAR Electric nor WMECO owns any coal-fired, oil-fired, or hydro-electric generating facilities, and each purchases its respective
energy requirements from competitive energy suppliers.
In 2009, WMECO was authorized by the DPU to install solar energy generation in its service territory. From 2010 through 2014, WMECO
completed development of a total of 8 MW solar generation facilities on sites in Pittsfield, Springfield, and East Springfield, Massachusetts.
WMECO will sell all energy and other products from its solar generation facilities into the ISO-NE market. NSTAR Electric does not own any solar
generation facilities.
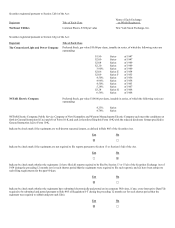
The following table shows the sources of the 2014 electric franchise retail revenues of NSTAR Electric and WMECO based on categories of
customers:
NSTAR Electric WMECO
2014 % of Total 2014 % of Total
Residential $1,101,704 46 $233,675 56
Commercial 1,161,466 49 131,093 31
Industrial 89,643 437,211 9
Other 29,765 115,470 4
Total Retail Electric Revenues $2,382,578 100% $417,449 100%
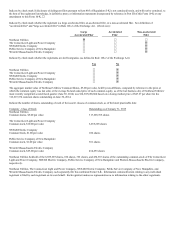
A summary of NSTAR Electric's and WMECO's retail electric GWh sales volumes and percentage changes for 2014, as compared to 2013, is as
follows:
NSTAR Electric WMECO
2014 2013
Percentage
Change 2014 2013
Percentage
Change
Residential 6,625 6,831 (3.0)% 1,494 1,544 (3.2)%
Commercial 13,009 13,163 (1.2)% 1,466 1,496 (2.0)%
Industrial 1,291 1,312 (1.6)% 626 643 (2.5)%
Total 20,925 21,306 (1.8)%3,586 3,683 (2.6)%
Rates
NSTAR Electric and WMECO are each subject to regulation by the DPU, which, among other things, has jurisdiction over rates, certain dispositions
of property and plant, mergers and consolidations, issuances of long-term securities, acquisition of securities, standards of service and construction
and operation of facilities. The present general rate structure for both NSTAR Electric and WMECO consists of various rate and service
classifications covering residential, commercial and industrial services. Massachusetts utilities are entitled under state law to charge rates that are
sufficient to allow them an opportunity to recover their reasonable operating and capital costs, in order to attract needed capital and maintain their
financial integrity, while also protecting relevant public interests.
Under Massachusetts law, all customers of each of NSTAR Electric and WMECO are entitled to choose their energy suppliers, while NSTAR
Electric or WMECO remains their electric distribution company. Both NSTAR Electric and WMECO purchase power from competitive suppliers on
behalf of, and pass the related cost through to, their respective customers who do not choose a competitive energy supplier (basic service). Most of
the residential and small commercial and industrial customers of NSTAR Electric and WMECO have continued to buy their power from NSTAR
Electric or WMECO at basic service rates. Most large commercial and industrial customers have switched to a competitive energy supplier.
The Cape Light Compact, an inter-governmental organization consisting of the 21 towns and two counties on Cape Cod and Martha's Vineyard,
serves 200,000 customers through the delivery of energy efficiency programs, effective consumer advocacy, competitive electricity supply and green
power options. NSTAR Electric continues to provide electric service to these customers including the delivery of power, maintenance of
infrastructure, capital investment, meter reading, billing, and customer service.