Eversource 2012 Annual Report Download - page 3
Download and view the complete annual report
Please find page 3 of the 2012 Eversource annual report below. You can navigate through the pages in the report by either clicking on the pages listed below, or by using the keyword search tool below to find specific information within the annual report.-
 1
1 -
 2
2 -
 3
3 -
 4
4 -
 5
5 -
 6
6 -
 7
7 -
 8
8 -
 9
9 -
 10
10 -
 11
11 -
 12
12 -
 13
13 -
 14
14 -
15
-
16
-
17
-
18
-
19
-
20
-
21
-
22
-
23
-
24
-
25
-
26
-
27
-
28
-
29
-
30
-
31
-
32
-
33
-
34
-
35
-
36
-
37
-
38
-
39
-
40
-
41
-
42
-
43
-
44
-
45
-
46
-
47
-
48
-
49
-
50
-
51
-
52
-
53
-
54
-
55
-
56
-
57
-
58
-
59
-
60
-
61
-
62
-
63
-
64
-
65
-
66
-
67
-
68
-
69
-
70
-
71
-
72
-
73
-
74
-
75
-
76
-
77
-
78
-
79
-
80
-
81
-
82
-
83
-
84
-
85
-
86
-
87
-
88
-
89
-
90
-
91
-
92
-
93
-
94
-
95
-
96
-
97
-
98
-
99
-
100
-
101
-
102
-
103
-
104
-
105
-
106
-
107
-
108
-
109
-
110
-
111
-
112
-
113
-
114
-
115
-
116
-
117
-
118
-
119
-
120
-
121
-
122
-
123
-
124
-
125
-
126
-
127
-
128
-
129
-
130
-
131
-
132
-
133
-
134
-
135
-
136
-
137
-
138
-
139
-
140
-
141
-
142
-
143
-
144
-
145
-
146
-
147
-
148
-
149
-
150
-
151
-
152
-
153
-
154
-
155
-
156
-
157
-
158
-
159
-
160
 |
 |

Selected Financial Data
Total Shareholder Return
(Thousands of dollars, except share information and statistical data) 2012 2011
Operating Revenues $ 6,273,787 $ 4,465,657
Operating Income $ 1,118,206 $ 794,176
Net Income Attributable to NU Common Shares $ 525,945 $ 394,693
Diluted Earnings per Common Share (GAAP) $ 1.89 $ 2.22
Diluted Earnings per Common Share (Non-GAAP) $ 2.28 $ 2.38
Diluted Common Shares Outstanding (Weighted Average) 277,993,631 177,804,568
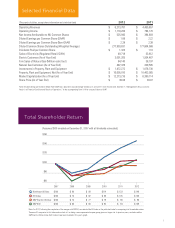
Dividends Paid per Common Share $ 1.323 $ 1.10
Sales of Electricity (Regulated Retail, GWh) 49,718 33,812
Electric Customers (As of Year End) 3,091,265 1,934,467
Firm Sales of Natural Gas (Million cubic feet) 64,140 38,197
Natural Gas Customers (As of Year End) 487,478 209,595
Investments in Property, Plant and Equipment $ 1,472,272 $ 1,076,730
Property, Plant and Equipment, Net (As of Year End) $ 16,605,010 $ 10,403,065
Market Capitalization (As of Year End) $ 12,273,216 $ 6,390,114
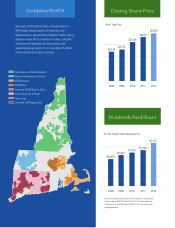
Share Price (As of Year End) $ 39.08 $ 36.07
2007 2008 2009 2010 2011 2012
$60
$80
$100
$120
$140
$160
(Assumes $100 invested on December 31, 2007 with all dividends reinvested.)
Northeast Utilities $100 $ 80 $ 89 $ 114 $ 133 $ 149
EEI Index $100 $ 74 $ 82 $ 88 $ 105 $ 108
S&P Electric Utilities $100 $ 74 $ 77 $ 79 $ 96 $ 96
S&P 500 $100 $ 63 $ 80 $ 92 $ 94 $ 109
1
Note: Diluted Earnings per Common Share (Non-GAAP) was adjusted to exclude merger-related costs and a 2011 storm fund reserve. See Item 7, “Management’s Discussion and
Analysis of Financial Condition and Results of Operations,” in the accompanying Form 10-K for a reconciliation to GAAP.
Note: For 2012, following the completion of the merger with NSTAR, we selected the EEI Index as the published index for comparing total shareholder return.
There are 51 companies in this index and we look at it as being a more representative peer group given our larger size. In previous years, we had used the
S&P Electric Utilities Index. Both indices have been included in this year’s graph.