Eversource 2001 Annual Report Download - page 6
Download and view the complete annual report
Please find page 6 of the 2001 Eversource annual report below. You can navigate through the pages in the report by either clicking on the pages listed below, or by using the keyword search tool below to find specific information within the annual report.-
 1
1 -
 2
2 -
 3
3 -
 4
4 -
 5
5 -
 6
6 -
 7
7 -
 8
8 -
 9
9 -
 10
10 -
 11
11 -
 12
12 -
 13
13 -
 14
14 -
 15
15 -
 16
16 -
 17
17 -
18
-
19
-
20
-
21
-
22
-
23
-
24
-
25
-
26
-
27
-
28
-
29
-
30
-
31
-
32
-
33
-
34
-
35
-
36
-
37
-
38
-
39
-
40
-
41
-
42
-
43
-
44
-
45
-
46
-
47
-
48
-
49
-
50
-
51
-
52
-
53
-
54
-
55
-
56
-
57
-
58
 |
 |

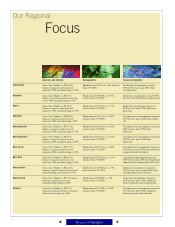
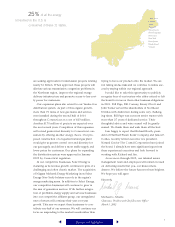
Our Regional
Focus
Connecticut
4
Gross State Product is $161.4 b;
finance, insurance and real estate
represent 29%; manufacturing is 16%
Population of 3.29 m is a .8% increase
from ‘95-2000
Residential consumption is nearly
30% of the state total; 28% from
transportation
Business and Industry Demographics Energy Consumption
Delaware Gross State Product is $37.7 b;
finance, insurance and real estate rep-
resent 40%; manufacturing is 14%
Population of 784,000 is a 9.1%
increase from ’95-2000
Industrial consumption is nearly 40%
of state total; 25% from transportation
Maine Gross State Product is $37.6 b;
finance, insurance and real estate
represent 19%; manufacturing is 15%
Population of 1.259 m is a 1.7%
increase from ’95-2000
Industrial consumption represents
49% of state total; 21% from trans-
portation
Maryland Gross State Product is $186.8 b;
finance, insurance and real estate
represent 21%; manufacturing is 8%
Population of 5.212 m is a 3.8%
increase from ’95-2000
Transportation consumption represents
29% of state total; 26% from residen-
tial
Massachusetts Gross State Product is $279.4 b;
finance, insurance and real estate
represent 25%; manufacturing is 14%
Population of 6.206 m is a 2.4%
increase from ’95-2000
Transportation consumption represents
28% of state total; 25% from
industrial
New Hampshire Gross State Product is $46.6 b;
finance, insurance and real estate
represent 24%; manufacturing is 20%
Population of 1.216 m is a 6.2 %
increase from ’95-2000
Transportation consumption represents
30% of state total; 29% from
industrial
New Jersey Gross State Product is $357.3 b;
finance, insurance and real estate
represent 24%; manufacturing is 12%
Population of 8.191 m is a 2.8%
increase from ’95-2000
Transportation consumption represents
33% of state total; 67% from industrial,
commercial and residential
New York Gross State Product is $823.5 b;
finance, insurance and real estate
represent 32%; manufacturing is 10%
Population of 18.234 m is a .5 %
increase from ’95-2000
Commercial consumption represents
28% of state total; 26% from residential;
industrial and transportation 23% each
Pennsylvania Gross State Product is $412.2 b;
finance, insurance and real estate and
manufacturing each represent 19%
Population of 11.986 m is a .5%
decrease from ’95-2000
Industrial consumption represents
35% of state total; nearly 50% from
transportation and residential
Rhode Island Gross State Product is $35 b; finance,
insurance and real estate and
manufacturing comprise 40%
Population of 994,000 is a .5%
increase from ’95-2000
Industrial consumption represents
30% of state total; 50% combined
from residential and transportation
Vermont Gross State Product is $18.5 b;
manufacturing and finance, insurance
and real estate represent 34%
Population of 597,000 is a 2.4%
increase from ’95-2000
Transportation consumption represents
32% of state total; 50% combined
from residential and industrial
Return to Highlights