Eversource 2001 Annual Report Download - page 5
Download and view the complete annual report
Please find page 5 of the 2001 Eversource annual report below. You can navigate through the pages in the report by either clicking on the pages listed below, or by using the keyword search tool below to find specific information within the annual report.-
 1
1 -
 2
2 -
 3
3 -
 4
4 -
 5
5 -
 6
6 -
 7
7 -
 8
8 -
 9
9 -
 10
10 -
 11
11 -
 12
12 -
 13
13 -
 14
14 -
 15
15 -
 16
16 -
17
-
18
-
19
-
20
-
21
-
22
-
23
-
24
-
25
-
26
-
27
-
28
-
29
-
30
-
31
-
32
-
33
-
34
-
35
-
36
-
37
-
38
-
39
-
40
-
41
-
42
-
43
-
44
-
45
-
46
-
47
-
48
-
49
-
50
-
51
-
52
-
53
-
54
-
55
-
56
-
57
-
58
 |
 |

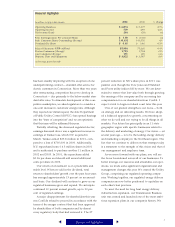
Financial Highlights
In millions, except per share amounts 2001 2000 % change
Operating Revenues $6,874 $ 5,877 +17%
Operating Income 539 695 -22%
Net Income/(Loss) 244 (29) (a)
Basic Earnings/(Loss) Per Common Share $1.80 $ (0.20) (a)
Basic Common Shares Outstanding (Average) 135,632 141,550 -4%
Dividends Per Share $0.45 $ 0.40 +12%
Sales of Electricity (kWh-millions) 85,984 75,660 +14%
Electric Customers (Average) 1,793 1,754 +2%
Gas Customers (Average) 191 185 +3%
Property, Plant and Equipment $3,822 $ 3,547 +8%
(a) Percentage greater than 100.
percent reduction in NU’s share price in 2001 was
painful, even though the Dow Jones and Standard
and Poors utility indices fell by more. We are deter-
mined to restore that lost value both through growing
the earnings of the company and by recovering fair
compensation for our shareholders from ConEd. I
expect a trial to begin in federal court later this year.
One of our greatest strengths is our focus — both
on strategy and on delivering results. We have adopt-
ed a balanced approach to growth, concentrating on
what we do well and not trying to be all things in all
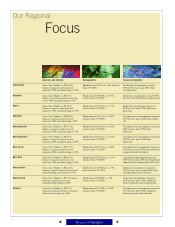
markets. Our future lies principally in an 11 state
geographic region with specific businesses related to
the delivery and marketing of energy. Our vision— set
several years ago— is to be the leading energy delivery
and marketing company in the Northeast region. The
fact that we continue to deliver on that strategy today
is a testament to the strength of this vision and that of
our management and employee team.
As we move forward with our plans, you will see
the focus I mentioned across all of our businesses. To
better leverage our resources and streamline our oper-
ations, we made some significant organizational and
management changes this year. We created the Utility
Group, comprising our regulated operating compa-
nies. Working together, our regulated energy delivery
companies are now better positioned to capitalize on
each other’s best practices.
T o meet the need for long haul energy delivery
infrastructure expansion, our Transmission Business
unit was created and launched one of the most ambi-
tious expansion plans in our company’s history. We
has been steadily improving with the exception of one
underperforming contract— standard offer service for
electric customers in Connecticut. More than two years
after restructuring, competition has yet to develop in
Connecticut— due primarily to the below-market stan-
dard offer rates. To stimulate development of this com-
petitive marketplace, we asked regulators to consider a
one-cent increase in customers’ energy rates. Although
they rejected our initial request, the state Department
of Public Utility Control (DPUC) has opened hearings
into the “state of competition” and we are optimistic
that this issue will be addressed this year.
Partially offsetting the decreased regulated electric
earnings discussed above was a significant increase in
earnings at Yankee Gas, which NU acquired in
March. Yankee earned $25.8 million in 2001, com-
pared to a loss of $700,000 in 2000. Additionally,
NU repurchased some 14.3 million shares in 2001
and is authorized to purchase another 11 million in
2002 and 2003. In 2001, the repurchases added
$0.06 per share and should add several additional
cents per share in 2002.
Our return on investment is at a predictable and
stable level. When we add in the dividend, total
return to shareholders’ growth over the past four years
has averaged approximately 13 percent on an annual-
ized basis. Our dividend will continue to grow as our
regulated businesses grow and expand. We anticipate
continued 10 percent annual growth, up to 50 per-
cent of regulated earnings.
A major disappointment for shareholders this year
was ConEd’s refusal to proceed in accordance with the
terms of the merger contract that had been approved
by shareholders of both companies and by almost
every regulatory body that had reviewed it. The 27
3
Return to First pageReturn to First pageReturn to HighlightsReturn to HighlightsReturn to Highlights