Eversource 1999 Annual Report Download - page 3
Download and view the complete annual report
Please find page 3 of the 1999 Eversource annual report below. You can navigate through the pages in the report by either clicking on the pages listed below, or by using the keyword search tool below to find specific information within the annual report.-
 1
1 -
 2
2 -
 3
3 -
 4
4 -
 5
5 -
 6
6 -
 7
7 -
 8
8 -
 9
9 -
 10
10 -
 11
11 -
 12
12 -
 13
13 -
 14
14 -
15
-
16
-
17
-
18
-
19
-
20
-
21
-
22
-
23
-
24
-
25
-
26
-
27
-
28
-
29
-
30
-
31
-
32
-
33
-
34
-
35
-
36
-
37
-
38
-
39
-
40
-
41
-
42
-
43
-
44
-
45
-
46
-
47
-
48
-
49
-
50
-
51
-
52
-
53
-
54
-
55
-
56
-
57
-
58
-
59
-
60
 |
 |

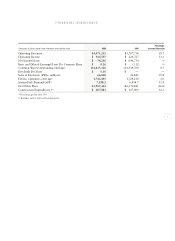
Percentage
(Thousands of Dollars, except share information and statistical data) 1999 1998 Increase/(Decrease)
Operating Revenues $4,471,251 $3,767,714 18.7
Operating Income $ 344,537 $ 224,727 53.3
Net Income/(Loss) $ 34,216 $ (146,753) (a)
Basic and Diluted Earnings/(Loss) Per Common Share $ 0.26 $ (1.12) (a)
Common Shares Outstanding (Average) 131,415,126 130,549,760 0.7
Dividends Per Share $ 0.10 $— —
Sales of Electricity (kWh - millions) 66,848 41,842 59.8
Electric Customers (Average) 1,746,493 1,729,250 1.0
System Peak Demand (MW) 7,188.2 6,454.7 11.4
Net Utility Plant $3,947,434 $6,170,881 (36.0)
Construction Expenditures (b) $ 287,081 $ 217,009 32.3
(a) Percentage greater than 100.
(b) Excludes nuclear fuel and leased property.
1
FINANCIAL HIGHLIGHTS