Equifax 2013 Annual Report Download - page 7
Download and view the complete annual report
Please find page 7 of the 2013 Equifax annual report below. You can navigate through the pages in the report by either clicking on the pages listed below, or by using the keyword search tool below to find specific information within the annual report.-
 1
1 -
 2
2 -
 3
3 -
 4
4 -
 5
5 -
 6
6 -
 7
7 -
 8
8 -
 9
9 -
 10
10 -
 11
11 -
 12
12 -
 13
13 -
 14
14 -
 15
15 -
 16
16 -
 17
17 -
 18
18 -
19
-
20
-
21
-
22
-
23
-
24
-
25
-
26
-
27
-
28
-
29
-
30
-
31
-
32
-
33
-
34
-
35
-
36
-
37
-
38
-
39
 |
 |

10 EQUIFAX 2013 ANNUAL REPORT
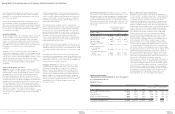
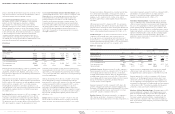
Key Performance Indicators. Management focuses on a variety of
key indicators to monitor operating and financial performance. These
performance indicators include measurements of operating revenue,
change in operating revenue, operating income, operating margin,
net income, diluted earnings per share, cash provided by operating
activities and capital expenditures. Key performance indicators for the
twelve months ended December 31, 2013, 2012 and 2011, include
the following:
Key Performance Indicators
Twelve Months Ended
December 31,
(Dollars in millions,
except per share data) 2013 2012 2011
Operating revenue $2,303.9 $2,073.0 $1,893.2
Operating revenue change 11% 10% 5%
Operating income $ 611.2 $ 480.0 $ 468.6
Operating margin 26.5% 23.2% 24.8%
Net income attributable to
Equifax $ 351.8 $ 272.1 $ 232.9
Diluted earnings per share
from continuing
operations $ 2.69 $ 2.18 $ 1.86
Cash provided by operating
activities $ 566.3 $ 496.3 $ 408.7
Capital expenditures $ 83.3 $ 66.0 $ 75.0
Business Environment and Company Outlook
Demand for our services tends to be correlated to general levels of
economic activity, to consumer credit activity, to a lesser extent small
commercial credit and marketing activity, and to our own initiatives
to expand our products and markets served. In 2013, in the
United States, we experienced modest growth in overall economic
activity and in general consumer credit, a moderate year-over-year
decline in consumer mortgage activity, and continuing benefits from
our internal product and market initiatives. As expected, after growing
in the first half of 2013, total company mortgage related revenues
declined significantly in the second half of 2013, a trend we expect
will continue into the first half of 2014. As a result, our Mortgage
Solutions business unit’s rate of year-over-year revenue growth
slowed in 2013 and the mortgage-related components of revenue
included in USCIS’ Online Consumer Information Solutions and
Workforce Solutions’ Verification Services each declined in absolute
terms compared to 2012. While we continue to expect modest
growth in overall economic activity and general consumer credit to
continue in 2014, mortgage market origination activity is expected to
continue declining due to elevated interest rates. Internationally, the
environment continues to be challenging as various countries address
their particular political, fiscal and economic issues. In addition, recent
weakening in foreign exchange rates of certain of the countries in
which we participate will reduce growth in revenue and profit when
reported in U.S. dollars. Offsetting these challenges, we continue to
expect that our ongoing investments in new product innovation, busi-
ness execution, enterprise growth initiatives, technology
infrastructure, and continuous process improvement will enable us, in
a modestly growing economy, to deliver long-term average organic
revenue growth ranging between 6% and 8% with additional growth
of 1% to 2% derived from strategic acquisitions consistent with our
long term business strategy. We also expect to grow earnings per
share at a somewhat faster rate than revenue over time as a result of
both operating and financial leverage. In 2014, we expect to offset
the negative growth in mortgage-related revenues with strong
revenue growth in our core, non-mortgage market initiatives.
RESULTS OF OPERATIONS —
TWELVE MONTHS ENDED DECEMBER 31, 2013, 2012 AND 2011
Consolidated Financial Results
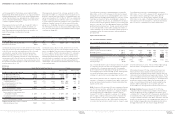
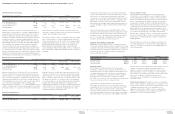
Operating Revenue
Operating Revenue Twelve Months Ended December 31, Change
2013 vs. 2012 2012 vs. 2011
(Dollars in millions) 2013 2012 2011 $% $%
U.S. Consumer Information Solutions $1,013.4 $ 869.3 $ 765.0 $144.1 17% $104.3 14%
International 513.5 486.2 492.9 27.3 6% (6.7) -1%
Workforce Solutions 474.1 442.1 382.1 32.0 7% 60.0 16%
North America Personal Solutions 207.4 185.5 163.9 21.9 12% 21.6 13%
North America Commercial Solutions 95.5 89.9 89.3 5.6 6% 0.6 1%
Consolidated operating revenue $2,303.9 $2,073.0 $1,893.2 $230.9 11% $179.8 9%
9 EQUIFAX 2013 ANNUAL REPORT
As used herein, the terms Equifax, the Company, we, our and us
refer to Equifax Inc., a Georgia corporation, and its consolidated
subsidiaries as a combined entity, except where it is clear that the
terms mean only Equifax Inc.
All references to earnings per share data in Management’s Discus-
sion and Analysis, or MD&A, are to diluted earnings per share, or
EPS, unless otherwise noted. Diluted EPS is calculated to reflect the
potential dilution that would occur if stock options or other contracts
to issue common stock were exercised and resulted in additional
common shares outstanding.
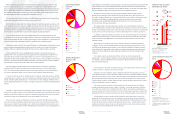
BUSINESS OVERVIEW
We are a leading global provider of information solutions and human
resources business process outsourcing services for businesses,
governments, and consumers. We leverage some of the largest
sources of consumer and commercial data, along with advanced
analytics and proprietary decisioning technology, to create custom-
ized insights which enable our business clients to grow faster, more
efficiently and more profitably, and to inform and empower
consumers.
Clients rely on us for consumer and business credit intelligence,
credit portfolio management, fraud detection, decisioning technology,
marketing tools, and human resources and payroll services. We also
offer a portfolio of products that enable individual consumers to man-
age their financial affairs and protect their identity. Our revenue
stream is diversified among individual consumers and among busi-
nesses across a wide range of industries and international
geographies.
Segment and Geographic Information
Segments. The U.S. Consumer Information Solutions, or USCIS,
segment, the largest of our five segments, consists of three product
and service lines: Online Consumer Information Solutions, or OCIS;
Mortgage Solutions; and Consumer Financial Marketing Services.
OCIS and Mortgage Solutions revenue is principally transaction-
based and is derived from our sales of products such as consumer
credit reporting and scoring, identity management and authentication,
fraud detection and modeling services. USCIS also markets certain of
our decisioning products which facilitate and automate a variety of
consumer credit-oriented decisions. Consumer Financial Marketing
Services revenue is principally project- and subscription-based and is
derived from our sales of batch credit, consumer wealth or
demographic information such as those that assist clients in acquiring
new customers, cross-selling to existing customers and managing
portfolio risk.
The International segment consists of Latin America, Europe and
Canada Consumer. Canada Consumer’s products and services are
similar to our USCIS offerings, while Europe and Latin America are
made up of varying mixes of product lines that are in our USCIS,
North America Commercial Solutions and North America Personal
Solutions reportable segments.
The Workforce Solutions segment consists of the Verification
Services and Employer Services business units. Verification Services
revenue is transaction based and is derived primarily from employ-
ment, income and social security number verifications. Employer
Services revenues are derived from our provision of certain human
resources business process outsourcing services that include both
transaction- and subscription-based product offerings. These
services assist our clients with the administration of unemployment
claims and employer-based tax credits and the handling of certain
payroll-related transaction processing.
North America Personal Solutions revenue is both transaction- and
subscription-based and is derived from the sale of credit monitoring
and identity theft protection products, which we deliver electronically
to consumers primarily via the internet and to a lesser extent through
mail.
North America Commercial Solutions revenue is principally transac-
tion based, with the remainder project based, and is derived from the
sale of business information, credit scores and portfolio analytics that
enable clients to utilize our reports to make financial, marketing and
purchasing decisions related to businesses.
Geographic Information. We currently operate in the following
countries: Argentina, Brazil, Canada, Chile, Costa Rica, Ecuador,
El Salvador, Honduras, Mexico, Paraguay, Peru, Portugal, the
Republic of Ireland, Spain, the U.K., Uruguay, and the U.S. Our
operations in the Republic of Ireland focus on data handling and
customer support activities. We have an investment in the second
largest consumer and commercial credit information company in
Brazil and offer consumer credit services in India and Russia through
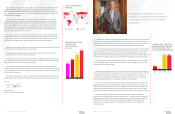
joint ventures. Of the countries we operate in, 77% of our revenue
was generated in the U.S. during the twelve months ended
December 31, 2013.
MANAGEMENT’S DISCUSSION AND ANALYSIS OF FINANCIAL CONDITION AND RESULTS OF OPERATIONS