Equifax 2013 Annual Report Download - page 13
Download and view the complete annual report
Please find page 13 of the 2013 Equifax annual report below. You can navigate through the pages in the report by either clicking on the pages listed below, or by using the keyword search tool below to find specific information within the annual report.-
 1
1 -
2
-
 3
3 -
 4
4 -
 5
5 -
 6
6 -
 7
7 -
 8
8 -
 9
9 -
 10
10 -
 11
11 -
 12
12 -
 13
13 -
 14
14 -
 15
15 -
 16
16 -
 17
17 -
 18
18 -
 19
19 -
 20
20 -
 21
21 -
 22
22 -
 23
23 -
24
-
25
-
26
-
27
-
28
-
29
-
30
-
31
-
32
-
33
-
34
-
35
-
36
-
37
-
38
-
39
 |
 |

21 EQUIFAX 2013 ANNUAL REPORT
Long-term ratings of BBB- and Baa3 or better by S&P and Moody’s,
respectively, reflect ratings on debt obligations that fall within a band
of credit quality considered to be ‘‘investment grade’’. At
December 31, 2013, the long-term ratings for our obligations were
BBB+ and Baa1, which are consistent with the ratings and outlooks
which existed at December 31, 2012. A downgrade in our credit rat-
ing would increase the cost of borrowings under our CP program and
credit facilities, and could limit, or in the case of a significant
downgrade, preclude our ability to issue CP. If our credit ratings were
to decline to lower levels, we could experience increases in the inter-
est cost for any new debt. In addition, the market’s demand for, and
thus our ability to readily issue, new debt could become further
affected by the economic and credit market environment.
For additional information about our debt, including the terms of our
financing arrangements, basis for variable interest rates and debt
covenants, see Note 6 of the Notes to Consolidated Financial State-
ments in this report.
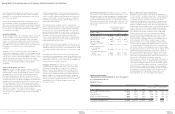
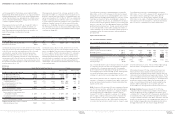
Equity Transactions
Net cash provided by (used in): Twelve Months Ended December 31, Change
(Dollars in millions) 2013 2012 2011 2013 vs. 2012 2012 vs. 2011
Treasury stock purchases $ (11.9) $(85.1) $(142.3) $ 73.2 $57.2
Dividends paid to Equifax shareholders $(106.7) $(86.0) $ (78.1) $(20.7) $ (7.9)
Dividends paid to noncontrolling interests $ (10.5) $ (4.8) $ (5.6) $ (5.7) $ 0.8
Proceeds from exercise of stock options $ 47.8 $ 68.3 $ 23.7 $(20.5) $44.6
Excess tax benefits from stock-based
compensation plans $ 14.6 $ 1.7 $ 1.2 $ 12.9 $ 0.5
Contributions from noncontrolling interests $ 16.7 $— $ — $ 16.7 $—
Sources and uses of cash related to equity during the twelve months
ended December 31, 2013, 2012 and 2011 were as follows:
• Under share repurchase programs authorized by our Board of
Directors, we purchased 0.2 million, 1.9 million, and 4.2 million
common shares on the open market during the twelve months
ended December 31, 2013, 2012 and 2011, respectively, for
$11.9 million, $85.1 million and $142.3 million, respectively, at an
average price per common share of $59.74, $45.73 and $34.19,
respectively. At December 31, 2013, under the existing board
authorization, the Company is approved for additional stock
repurchases valued at $215.1 million.
• During the twelve months ended December 31, 2013, 2012 and
2011, we paid cash dividends to Equifax shareholders of
$106.7 million, $86.0 million and $78.1 million, respectively, at
$0.88 per share for 2013, $0.72 per share for 2012 and $0.64 per
share for 2011.
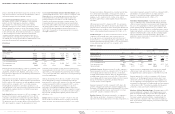
Contractual Obligations and Commercial Commitments
The following table summarizes our significant contractual obligations and commitments as of December 31, 2013. The table excludes com-
mitments that are contingent based on events or factors uncertain at this time. Some of the excluded commitments are discussed below the
footnotes to the table.
Payments due by
(In millions) Total Less than 1 year 1 to 3 years 3 to 5 years Thereafter
Debt (including capitalized lease obligation)
(1)
$1,438.1 $290.6 $ — $272.5 $ 875.0
Operating leases
(2)
97.2 19.1 24.2 13.6 40.3
Data processing, outsourcing agreements
and other purchase obligations
(3)
97.5 66.0 24.7 3.8 3.0
Other long-term liabilities
(4)(6)
98.4 6.7 13.1 10.5 68.1
Interest payments
(5)
750.9 66.2 119.6 93.9 471.2
$2,482.1 $448.6 $181.6 $394.3 $1,457.6
(1) The amounts are gross of unamortized discounts totaling $2.1 million and fair value adjustments of $6.0 million at December 31, 2013.
Total debt on our Consolidated Balance Sheets is net of the unamortized discounts and fair value adjustments.
(2) Our operating lease obligations principally involve office space and equipment, which include the ground lease associated with our
headquarters building that expires in 2048.
(3) These agreements primarily represent our minimum contractual obligations for services that we outsource associated with our computer
data processing operations and related functions, and certain administrative functions. These agreements expire between 2013 and
2018.
(4) These long-term liabilities primarily relate to obligations associated with certain pension, postretirement and other compensation-related
plans, some of which are discounted in accordance with U.S. generally accepted accounting principles, or GAAP. We made certain
MANAGEMENT’S DISCUSSION AND ANALYSIS OF FINANCIAL CONDITION AND RESULTS OF OPERATIONS continued
22 EQUIFAX 2013 ANNUAL REPORT
assumptions about the timing of such future payments. In the table above, we have not included amounts related to future pension plan
obligations, as such required funding amounts beyond 2013 have not been deemed necessary due to our current expectations regarding
future plan asset performance.
(5) For future interest payments on variable-rate debt, which are generally based on a specified margin plus a base rate (LIBOR) or on CP
rates for investment grade issuers, we used the variable rate in effect at December 31, 2013 to calculate these payments. Our variable
rate debt at December 31, 2013, consisted of CP, borrowings under our credit facilities and our five-year senior notes due 2014 (against
which we have executed interest rate swaps to convert interest expense from fixed rates to floating rates). Future interest payments
related to our Senior Credit Facility and our CP program are based on the borrowings outstanding at December 31, 2013 through their
respective maturity dates, assuming such borrowings are outstanding until that time. The variable portion of the rate at December 31,
2013 ranged from 1.87% to 2.04% for all of our variable-rate debt. Future interest payments may be different depending on future bor-
rowing activity and interest rates.
(6) This table excludes $22.6 million of unrecognized tax benefits, including interest and penalties, as we cannot make a reasonably reliable
estimate of the period of cash settlement with the respective taxing authorities.
Off-Balance Sheet Transactions
We do not engage in off-balance sheet financing activities.
Pursuant to the terms of certain industrial revenue bonds, we have
transferred title to certain of our fixed assets with total costs of
$82.6 million and $70.7 million, as of December 31, 2013 and 2012,
respectively, to a local governmental authority in the U.S. to receive a
property tax abatement related to economic development. The title to
these assets will revert back to us upon retirement or cancellation of
the applicable bonds. These fixed assets are still recognized on the
Company’s Consolidated Balance Sheets as all risks and rewards
remain with the Company.
Letters of Credit and Guarantees
We will from time to time issue standby letters of credit, performance
bonds or other guarantees in the normal course of business. The
aggregate notional amount of all performance bonds and standby
letters of credit was not material at December 31, 2013, and all have
a remaining maturity of one year or less. Guarantees are issued from
time to time to support the needs of our operating units. The
maximum potential future payments we could be required to make
under the guarantees is not material at December 31, 2013.
Benefit Plans
We sponsor a qualified defined benefit retirement plan (the U.S.
Retirement Income Plan, or USRIP) that covers approximately 20% of
current U.S. salaried employees who were hired on or before
June 30, 2007, the last date on which an individual could be hired
and enter the plan before the USRIP was frozen to new participation
at December 31, 2008. This plan also covers many retirees as well as
certain terminated but vested individuals not yet in retirement status.
We also sponsor a defined benefit plan that covers most salaried and
hourly employees in Canada (the Canadian Retirement Income Plan,
or CRIP). The CRIP was frozen to new participants entering the plan
on or after October 1, 2011.
At December 31, 2013, the USRIP met or exceeded ERISA’s
minimum funding requirements. During the twelve months ended
December 31, 2013 and 2012, we did not make any contributions to
the USRIP. We contributed $2.6 million and $3.7 million to the CRIP
during the twelve months ended December 31, 2013 and 2012,
respectively. In the future, we will make minimum funding contribu-
tions as required and may make discretionary contributions,
depending on certain circumstances, including market conditions and
liquidity needs. We believe additional funding contributions, if any,
would not prevent us from continuing to meet our liquidity needs,
which are primarily funded from cash flows generated by operating
activities, available cash and cash equivalents, and our credit
facilities.
For our non-U.S., tax-qualified retirement plans, we fund an amount
sufficient to meet minimum funding requirements but no more than
allowed as a tax deduction pursuant to applicable tax regulations. For
the non-qualified supplementary retirement plans, we fund the
benefits as they are paid to retired participants, but accrue the
associated expense and liabilities in accordance with GAAP.
For additional information about our benefit plans, see Note 11 of the
Notes to Consolidated Financial Statements in this report.
Seasonality
We experience seasonality in certain of our revenue streams.
Revenue generated from the Employer Services business unit within
the Workforce Solutions operating segment is generally higher in the
first quarter due primarily to the provision of Form W-2 preparation
services, which occur in the first quarter each year. Revenue from our
OCIS and Mortgage Solutions business units tends to increase in
periods of the year in which our customers have higher volumes of
credit granting decisions, most commonly the second and third
calendar quarters. Revenues in our North America Commercial busi-
ness and the Consumer Financial Marketing Services business line
within USCIS are typically highest in the fourth quarter each year due
to the timing of certain significant annual renewals of project-based
agreements. On a consolidated basis, combining all of these busi-
nesses, and assuming normal economic conditions, first quarter
revenue is normally the lowest quarterly revenue of the year, and the
fourth quarter is the highest.