Equifax 2013 Annual Report Download - page 20
Download and view the complete annual report
Please find page 20 of the 2013 Equifax annual report below. You can navigate through the pages in the report by either clicking on the pages listed below, or by using the keyword search tool below to find specific information within the annual report.-
 1
1 -
2
-
3
-
4
-
5
-
6
-
7
-
8
-
9
-
 10
10 -
 11
11 -
 12
12 -
 13
13 -
 14
14 -
 15
15 -
 16
16 -
 17
17 -
 18
18 -
 19
19 -
 20
20 -
 21
21 -
 22
22 -
 23
23 -
 24
24 -
 25
25 -
 26
26 -
 27
27 -
 28
28 -
 29
29 -
 30
30 -
31
-
32
-
33
-
34
-
35
-
36
-
37
-
38
-
39
 |
 |

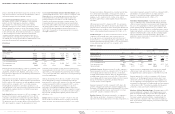
35 EQUIFAX 2013 ANNUAL REPORT
Twelve Months Ended
December 31,
(In millions) 2013 2012 2011
Operating activities:
Consolidated net income $ 359.9 $ 280.8 $ 241.7
Adjustments to reconcile consolidated net income to net cash provided by
operating activities:
Loss (gain) on divestitures (19.0) — 26.3
Impairment of cost method investment 17.0 ——
Depreciation and amortization 190.3 163.4 164.9
Stock-based compensation expense 32.2 28.0 24.4
Excess tax benefits from stock-based compensation plans (14.6) (1.7) (1.2)
Deferred income taxes (9.7) (26.5) 3.6
Pension settlement charge —38.7 —
Changes in assets and liabilities, excluding effects of acquisitions:
Accounts receivable, net (2.4) (17.2) (26.6)
Prepaid expenses and other current assets (4.2) (22.5) 2.4
Other assets 4.4 (4.0) 15.0
Current liabilities, excluding debt 2.1 53.3 1.3
Other long-term liabilities, excluding debt 10.3 4.0 (43.1)
Cash provided by operating activities 566.3 496.3 408.7
Investing activities:
Capital expenditures (83.3) (66.0) (75.0)
Acquisitions, net of cash acquired (91.4) (1,016.4) (127.4)
Cash received from divestitures 47.5 2.5 2.5
Investment in unconsolidated affiliates, net (6.4) (3.7) (4.2)
Cash used in investing activities (133.6) (1,083.6) (204.1)
Financing activities:
Net short-term borrowings (repayments) (267.3) 234.1 24.4
Payments on long-term debt (15.0) (15.2) (16.7)
Proceeds from issuance of long-term debt —499.2 —
Treasury stock purchases (11.9) (85.1) (142.3)
Dividends paid to Equifax shareholders (106.7) (86.0) (78.1)
Dividends paid to noncontrolling interests (10.5) (4.8) (5.6)
Proceeds from exercise of stock options 47.8 68.3 23.7
Excess tax benefits from stock-based compensation plans 14.6 1.7 1.2
Contributions from noncontrolling interests 16.7 ——
Other (0.8) (5.9) (2.5)
Cash (used in) provided by financing activities (333.1) 606.3 (195.9)
Effect of foreign currency exchange rates on cash and cash equivalents (10.5) 0.1 (0.4)
Increase in cash and cash equivalents 89.1 19.1 8.3
Cash and cash equivalents, beginning of period 146.8 127.7 119.4
Cash and cash equivalents, end of period $ 235.9 $ 146.8 $ 127.7
See Notes to Consolidated Financial Statements.
CONSOLIDATED STATEMENTS OF CASH FLOWS
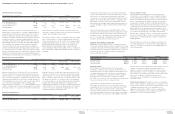
36 EQUIFAX 2013 ANNUAL REPORT
Equifax Shareholders
Common Stock
Paid-In
Capital Retained
Earnings
Accumulated
Other
Comprehensive
Loss Treasury
Stock
Stock Held By
Employee
Benefits Trusts Noncontrolling
Interests
Total
Shareholders’
Equity(In millions, except per share values)
Shares
Outstanding Amount
Balance, December 31, 2010 122.6 $236.6 $1,105.8 $2,725.7 $(344.5) $(1,991.0) $(41.2) $ 17.0 $1,708.4
Net income — — — 232.9 —— — 8.8 241.7
Other comprehensive income (loss) ————(47.3) — — — (47.3)
Shares issued under stock and benefit plans,
net of minimum tax withholdings 1.2 — (14.3) — — 34.9 — — 20.6
Treasury stock purchased under share
repurchase program ($34.19 per share)* (4.2) — — — — (142.3) — — (142.3)
Treasury stock transferred from the Execu-
tive Life Insurance Benefit Trust** ———— —(35.3) 35.3 — —
Cash dividends ($0.64 per share) — — — (79.4) —— — — (79.4)
Dividends paid to employee benefits trusts — — 1.3 — —— — — 1.3
Stock-based compensation expense — — 24.4 — —— — — 24.4
Tax effects of stock-based compensation
plans — — 2.3 — —— — — 2.3
Dividends paid to noncontrolling interests ———— —— — (5.6) (5.6)
Other — — (1.5) —— — (0.5) (2.0)
Balance, December 31, 2011 119.6 $236.6 $1,118.0 $2,879.2 $(391.8) $(2,133.7) $ (5.9) $ 19.7 $1,722.1
Net income — — — 272.1 —— — 8.7 280.8
Other comprehensive income (loss) ———— 29.8 — — (0.3) 29.5
Shares issued under stock and benefit plans,
net of minimum tax withholdings 2.7 — (16.6) — — 79.1 — — 62.5
Treasury stock purchased under share
repurchase program ($45.73 per share)* (1.9) — — — — (85.1) — — (85.1)
Cash dividends ($0.72 per share) — — — (86.7) —— — — (86.7)
Dividends paid to employee benefits trusts — — 0.7 — —— — — 0.7
Stock-based compensation expense — — 28.0 — —— — — 28.0
Tax effects of stock-based compensation
plans — — 9.5 — —— — — 9.5
Dividends paid to noncontrolling interests ———— —— — (4.8) (4.8)
Other ——— —— 2.7 2.7
Balance, December 31, 2012 120.4 $236.6 $1,139.6 $3,064.6 $(362.0) $(2,139.7) $ (5.9) $ 26.0 $1,959.2
Net income — — — 351.8 —— — 8.1 359.9
Other comprehensive income (loss) ———— 49.4 — — (2.9) 46.5
Shares issued under stock and benefit
plans, net of minimum tax withholdings 1.7 — (12.3) — — 50.4 — — 38.1
Treasury stock purchased under share
repurchase program ($59.74 per share)* (0.2) — — — — (11.9) — — (11.9)
Cash dividends ($0.88 per share) — — — (107.2) —— — — (107.2)
Dividends paid to employee benefits
trusts — — 0.5 — —— — — 0.5
Stock-based compensation expense — — 32.2 — —— — — 32.2
Tax effects of stock-based compensation
plans — — 14.6 — —— — — 14.6
Dividends paid to noncontrolling interests ———— —— —(10.5) (10.5)
Contributions from noncontrolling
interests ———— —— —16.7 16.7
Other ——— —— 2.9 2.9
Balance, December 31, 2013 121.9 $236.6 $1,174.6 $3,309.2 $(312.6) $(2,101.2) $ (5.9) $ 40.3 $2,341.0
* At December 31, 2013, $215.1 million was authorized for future repurchases of our common stock.
** 1,500,000 shares were reclassified from Stock Held by Employee Benefits Trusts to Treasury Stock on our Consolidated Balance Sheets as a result of this transaction.
See Notes to Consolidated Financial Statements.
CONSOLIDATED STATEMENTS OF SHAREHOLDERS’ EQUITY AND OTHER COMPREHENSIVE INCOME