Equifax 2011 Annual Report Download - page 15
Download and view the complete annual report
Please find page 15 of the 2011 Equifax annual report below. You can navigate through the pages in the report by either clicking on the pages listed below, or by using the keyword search tool below to find specific information within the annual report.-
 1
1 -
2
-
3
-
4
-
 5
5 -
 6
6 -
 7
7 -
 8
8 -
 9
9 -
 10
10 -
 11
11 -
 12
12 -
 13
13 -
 14
14 -
 15
15 -
 16
16 -
 17
17 -
 18
18 -
 19
19 -
 20
20 -
 21
21 -
 22
22 -
 23
23 -
 24
24 -
 25
25 -
26
-
27
-
28
-
29
-
30
-
31
-
32
-
33
-
34
-
35
-
36
-
37
-
38
-
39
-
40
-
41
-
42
-
43
-
44
-
45
-
46
-
47
-
48
-
49
-
50
-
51
-
52
-
53
-
54
-
55
-
56
-
57
-
58
-
59
-
60
-
61
-
62
-
63
-
64
-
65
-
66
-
67
-
68
-
69
-
70
-
71
-
72
-
73
-
74
-
75
-
76
-
77
-
78
-
79
-
80
 |
 |

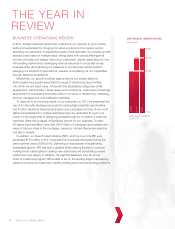
Key Performance Indicators. Management focuses on a variety of
key indicators to monitor operating and financial performance. These
performance indicators include measurements of operating revenue,
change in operating revenue, operating income, operating margin,
net income, diluted earnings per share, cash provided by operating
activities and capital expenditures. Key performance indicators for the
twelve months ended December 31, 2011, 2010 and 2009, include
the following:
Key Performance Indicators
Twelve Months Ended
December 31,
(Dollars in millions,
except per share data) 2011 2010 2009
Operating revenue $1,959.8 $1,859.5 $1,716.0
Operating revenue change 5% 8% -5%
Operating income $ 471.0 $ 430.0 $ 381.8
Operating margin 24.0% 23.1% 22.2%
Net income attributable
to Equifax $ 232.9 $ 266.7 $ 233.9
Diluted earnings per share
from continuing
operations $ 1.87 $ 1.86 $ 1.70
Cash provided by
operating activities $ 408.7 $ 352.6 $ 418.4
Capital expenditures $ 75.0 $ 99.8 $ 70.7
Operational and Financial Highlights.
• On May 31, 2011, we completed the merger of our Brazilian busi-
ness with Boa Vista Serviços S.A. (‘‘BVS’’) in exchange for a 15%
equity interest in BVS, which was accounted for as a sale and was
deconsolidated (the ‘‘Brazilian Transaction’’). BVS, an unrelated
third party whose results we do not consolidate, is the second
largest consumer and commercial credit information company
in Brazil.
• On August 2, 2011, we acquired DataVision Resources, which
provides data and business solutions to the mortgage, insurance
and financial services industries, for $50.0 million. DataVision
Resources is part of our TALX Workforce Solutions segment.
• We repurchased 4.2 million shares of our common stock on the
open market for $142.3 million during 2011.
Business Environment, Company Outlook and Strategy
Consumer and small business lending activity, is one of the key driv-
ers of demand for our services. Lending activity is now growing at a
moderate rate in most loan categories and markets around the world,
but lenders continue to demonstrate caution in loan decisions due to
continuing concerns about consumer and small business credit qual-
ity and about home values. Mortgage lending activity, which is an
important lending category for our company, is cyclical, based on
fluctuations in both home sales and refinancing activity; and
mortgage activity is currently below long term average activity levels,
in part due to reduced home values. In addition, new financial regula-
tions are increasing the compliance requirements for many of our
customers and introduce new challenges as well as opportunities in
the marketing of our product and service offerings to our customers.
Real time decision-making for many of our customers has become
more complex and reliant on quality data assets with broad market
coverage. Our proprietary technology is efficient and sufficiently flex-
ible to adapt to a broad array of decisioning applications. By linking
data assets, we are able to develop high value solutions that improve
the effectiveness of our customers’ decision-making activities. In an
effort to respond to these market conditions, we have focused on the
following activities:
• Further diversification of our revenues by pursuing and investing in
key strategic initiatives including new product innovation, differenti-
ated decisioning solutions and analytics, leveraging and
broadening our diverse data assets and enhancing our technology
platforms.
• Reorganizing our sales force with key customer teams dedicated
to our largest accounts and broadening our product offerings to
address the needs of our medium-to-smaller customers.
• Acquiring new data assets and technologies both domestically and
internationally.
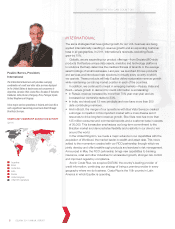
• Expanding and investing in attractive international markets,
including Russia, India and Brazil.
• Continuing our focus on managing expenses through the use of
LEAN and other process improvement initiatives.
In 2012, we do not expect measurable improvement in the overall
business environment. The environment will continue to be challeng-
ing as various countries deal with their particular political, budgetary,
and economic issues. However, we currently expect that with our
ongoing investments in new product innovation, technology
infrastructure, strategic acquisitions, enterprise growth initiatives, and
continuous process improvement will enable us to deliver long term
average organic revenue growth between 6% and 8% with additional
growth of 1% to 2% derived from strategic acquisitions, and we
expect to grow earnings per share at a somewhat faster rate than
revenue as a result of operating and financial leverage. The diversity
of our data assets, the strength of our analytical capabilities, and our
proprietary decisioning technology has enabled us to consistently
deliver high value solutions that our clients integrate into their busi-
ness operations. As our clients’ business environment becomes more
difficult and competitive, these high value solutions will enable them
to operate their businesses more efficiently and effectively.
EQUIFAX 2011 ANNUAL REPORT 13