Equifax 2003 Annual Report Download - page 2
Download and view the complete annual report
Please find page 2 of the 2003 Equifax annual report below. You can navigate through the pages in the report by either clicking on the pages listed below, or by using the keyword search tool below to find specific information within the annual report.
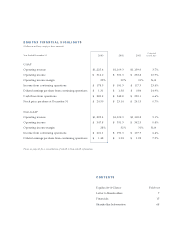
Compound
Year Ended December 31 2003 2002 2001 Growth Rate
GAAP
Operating revenue $1,225.4 $1,109.3 $1,139.0 3.7%
Operating income $ 312.0 $ 351.3 $ 253.8 10.9%
Operating income margin 25% 32% 31% N/A
Income from continuing operations $ 178.5 $ 191.3 $ 117.3 23.4%
Diluted earnings per share from continuing operations $ 1.31 $ 1.38 $ 0.84 24.9%
Cash flows from operations $ 289.9 $ 248.8 $ 255.1 6.6%
Stock price per share at December 31 $ 24.50 $ 23.14 $ 24.15 0.7%
Non-GAAP
Operating revenue $1,225.4 $1,109.3 $1,109.8 5.1%
Operating income $ 347.8 $ 351.3 $ 342.5 0.8%
Operating income margin 28% 32% 31% N/A
Income from continuing operations $ 201.1 $ 191.3 $ 177.7 6.4%
Diluted earnings per share from continuing operations $ 1.48 $ 1.38 $ 1.28 7.5%
Please see page 30 for a reconciliation of GAAP to Non-GAAP information.
** See reconciliation of GAAP to Non-GAAP information at page_____.
EQUIFAX FINANCIAL HIGHLIGHTS
(Dollars in millions, except per share amounts)
Equifax At-A-Glance Fold-out
Letter to Shareholders 7
Financials 15
Shareholder Information 68
CONTENTS

