Emerson 2011 Annual Report Download - page 15
Download and view the complete annual report
Please find page 15 of the 2011 Emerson annual report below. You can navigate through the pages in the report by either clicking on the pages listed below, or by using the keyword search tool below to find specific information within the annual report.-
 1
1 -
2
-
3
-
4
-
 5
5 -
 6
6 -
 7
7 -
 8
8 -
 9
9 -
 10
10 -
 11
11 -
 12
12 -
 13
13 -
 14
14 -
 15
15 -
 16
16 -
 17
17 -
 18
18 -
 19
19 -
 20
20 -
 21
21 -
 22
22 -
 23
23 -
 24
24 -
 25
25 -
26
-
27
-
28
-
29
-
30
-
31
-
32
-
33
-
34
-
35
-
36
-
37
-
38
-
39
-
40
-
41
-
42
-
43
-
44
-
45
-
46
-
47
-
48
-
49
-
50
-
51
-
52
-
53
-
54
-
55
-
56
-
57
-
58
 |
 |

Annual Report | 13
Results of Operations
Years ended September 30 | Dollars in millions, except per share amounts
CHANGE CHANGE
2009 2010 2011 2009 - 2010 2010 - 2011
Net sales $20,102 21,039 24,222 5% 15%
Gross profit $ 7,560 8,326 9,557 10% 15%
Percent of sales 37.6% 39.6% 39.5%
SG&A $ 4,416 4,817 5,328
Percent of sales 22.0% 22.9% 22.0%
Other deductions, net $ 474 369 375
Interest expense, net $ 220 261 223
Earnings from continuing operations
before income taxes $ 2,450 2,879 3,631 18% 26%
Percent of sales 12.2% 13.7% 15.0%
Earnings from continuing operations
common stockholders $ 1,715 1,978 2,454 15% 24%
Net earnings common stockholders $ 1,724 2,164 2,480 26% 15%
Percent of sales 8.6% 10.3% 10.2%
Diluted EPS – Earnings from continuing operations $ 2.26 2.60 3.24 15% 25%
Diluted EPS – Net earnings $ 2.27 2.84 3.27 25% 15%
Return on common stockholders’ equity 19.5% 23.6% 24.6%
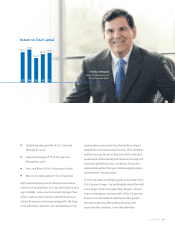
Return on total capital 16.2% 18.9% 19.6%
OVERVIEW
The Company achieved strong sales growth and record
earnings and earnings per share in 2011, led by innovative
technology, improved economic conditions in industrial
end markets, continued expansion in emerging markets
and repositioning efforts in previous periods. Worldwide
gross fixed investment continues to recover, however
the economic environment remains uncertain amidst
mixed macroeconomic indicators, including weakening
trends in the U.S. and Europe. Consumer spending and
residential construction remain weak. Fiscal year 2011
sales increased 15 percent and earnings per share from
continuing operations of $3.24 were up 25 percent.
Net sales were up in all segments and major geographic
regions for the year, aided by acquisitions and foreign
currency translation. Earnings increased for Process
Management and Industrial Automation on very strong
sales growth, while Tools and Storage and Climate
Technologies reported moderate sales and earnings
growth. Earnings declined in the Network Power segment
on weakness in Asia and the embedded computing and
power business, and the impact of higher amortization
and other costs related to the Chloride and Avocent
acquisitions. Fourth quarter sales and earnings growth
were strong for Process Management and Industrial
Automation, modest for Tools and Storage, and down for
Climate Technologies on lower volume. Fourth quarter
Network Power segment sales growth was strong due to
the Chloride acquisition and modest underlying growth,
while earnings declined slightly as improvement in the
network power systems business was offset by weakness
in the embedded computing and power business. For
2011 the Company generated operating cash flow of
$3.2 billion and free cash flow (operating cash flow less
capital expenditures) of $2.6 billion. Emerson is well
positioned for future sales and earnings growth given its
strong financial position, global footprint that includes
rapid expansion in emerging markets, and a focus on
products and technology.
NET SALES
Net sales for 2011 were $24.2 billion, an increase of
$3,183 million, or 15 percent from 2010. Sales grew in all
segments, led by Industrial Automation, Network Power
and Process Management, which were up $1,005 million,
$983 million and $978 million, respectively. Consolidated
results reflect an 11 percent ($2,216 million) increase
in underlying sales (which exclude acquisitions and
foreign currency translation), a 2 percent ($623 million)
contribution from acquisitions, and a 2 percent
($344 million) favorable impact from foreign currency
translation. Underlying sales reflect volume gains of