Emerson 2011 Annual Report Download - page 13
Download and view the complete annual report
Please find page 13 of the 2011 Emerson annual report below. You can navigate through the pages in the report by either clicking on the pages listed below, or by using the keyword search tool below to find specific information within the annual report.-
 1
1 -
2
-
 3
3 -
 4
4 -
 5
5 -
 6
6 -
 7
7 -
 8
8 -
 9
9 -
 10
10 -
 11
11 -
 12
12 -
 13
13 -
 14
14 -
 15
15 -
 16
16 -
 17
17 -
 18
18 -
 19
19 -
 20
20 -
 21
21 -
 22
22 -
 23
23 -
24
-
25
-
26
-
27
-
28
-
29
-
30
-
31
-
32
-
33
-
34
-
35
-
36
-
37
-
38
-
39
-
40
-
41
-
42
-
43
-
44
-
45
-
46
-
47
-
48
-
49
-
50
-
51
-
52
-
53
-
54
-
55
-
56
-
57
-
58
 |
 |

Annual Report | 11
ONE-YEAR PERFORMANCE
Years ended September 30 percent
Dollars in millions, except per share amounts 2010 2011 change
Sales $21,039 $24,222 15 %
Net earnings $ 2,164 $ 2,480 15 %
Net earnings per share $ 2.84 $ 3.27 15 %
Earnings per share from
continuing operations $ 2.60 $ 3.24 25 %
Dividends per share $ 1.34 $ 1.38 3%
Operating cash flow $ 3,292 $ 3,233 (2)%
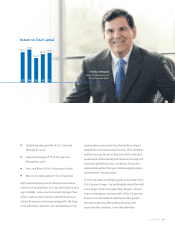
Return on total capital 18.9% 19.6%
Return on equity 23.6% 24.6%
FIVE-YEAR PERFORMANCE
Years ended September 30 five-year
Dollars in millions, except per share amounts 2006 2011 cagr
Sales $18,588 $24,222 5%
Net earnings $ 1,845 $ 2,480 6%
Net earnings per share $ 2.24 $ 3.27 8%
Earnings per share from
continuing operations $ 2.19 $ 3.24 8%
Dividends per share $ 0.89 $ 1.38 9%
Operating cash flow $ 2,512 $ 3,233 5%
Return on total capital 18.4% 19.6%
Return on equity 23.7% 24.6%
$3.27
EARNINGS
PER SHARE
$1.38
DIVIDENDS
PER SHARE
1956 – 2011
2002 earnings per share is before the $1.12 per share cumulative effect of a change in accounting principle.
Emerson’s dividend has increased
at a compound annual rate of
11 percent since 1956.