Eli Lilly 2004 Annual Report Download - page 15
Download and view the complete annual report
Please find page 15 of the 2004 Eli Lilly annual report below. You can navigate through the pages in the report by either clicking on the pages listed below, or by using the keyword search tool below to find specific information within the annual report.-
 1
1 -
2
-
3
-
4
-
 5
5 -
 6
6 -
 7
7 -
 8
8 -
 9
9 -
 10
10 -
 11
11 -
 12
12 -
 13
13 -
 14
14 -
 15
15 -
 16
16 -
 17
17 -
 18
18 -
 19
19 -
 20
20 -
 21
21 -
 22
22 -
 23
23 -
 24
24 -
 25
25 -
26
-
27
-
28
-
29
-
30
-
31
-
32
-
33
-
34
-
35
-
36
-
37
-
38
-
39
-
40
-
41
-
42
-
43
-
44
-
45
-
46
-
47
-
48
-
49
-
50
-
51
-
52
-
53
-
54
-
55
-
56
-
57
-
58
-
59
-
60
-
61
-
62
-
63
-
64
-
65
-
66
-
67
-
68
-
69
-
70
-
71
-
72
-
73
-
74
-
75
-
76
-
77
-
78
-
79
-
80
-
81
-
82
-
83
-
84
-
85
-
86
-
87
-
88
-
89
-
90
-
91
-
92
-
93
-
94
-
95
-
96
-
97
-
98
-
99
-
100
 |
 |

FINANCIALS
13
ing costs of Cialis in joint-venture territories, and the
2003 sale of dapoxetine patent rights. We report our 50
percent share of the operating results of the Lilly ICOS
joint venture in our net other income. For 2004, our net
loss from the joint venture was $79.0 million, compared
with $52.4 million in 2003.
The effective tax rate for 2004 was 38.5 percent,
compared with 21.5 percent for 2003. The increase in
the effective tax rate was caused by the tax provision
related to the expected repatriation of $8.00 billion of
earnings reinvested outside the U.S. pursuant to the
AJCA and the charge for acquired IPR&D related to the
AME acquisition, which is not deductible for tax purpos-
es. See Note 11 to the consolidated fi nancial statements
for additional information.
OPERATING RESULTS—2003
Financial Results
Net income was $2.56 billion, or $2.37 per share, in
2003 and $2.71 billion, or $2.50 per share, in 2002, a
decline of 5 percent. We achieved strong worldwide
sales growth of 14 percent, to $12.58 billion; however,
in order to position ourselves for sustained growth in
an increasingly competitive environment, we chose to
signifi cantly increase our investments in a number of
areas. To ensure the successful launches of our new
products, we substantially increased our sales and
marketing efforts. In addition, we made substantial
investments in our manufacturing operations and re-
search and development activities. These investments
into the business, together with lower net other income,
negatively affected earnings in 2003.
Certain items, refl ected in our operating results
for 2003 and 2002, should be considered in comparing
the two years. The signifi cant items for 2003 are sum-
marized in the Executive Overview. The 2002 charge is
summarized as follows (see Note 3 to the consolidated
fi nancial statements for additional information).
Gross Margin, Costs, and Expenses
The 2004 gross margin decreased to 76.7 percent of
sales compared with 78.7 percent for 2003. The de-
crease was due primarily to continued investment in our
manufacturing technical capabilities and capacity and
the impact of foreign exchange rates, offset partially by
favorable changes in product mix due to growth in sales
of higher margin products.
Operating expenses (the aggregate of research and
development and marketing and administrative expens-
es) increased 9 percent in 2004. Investment in research
and development increased 15 percent, to $2.69 billion,
due to increased clinical trial and development expenses
and increased incentive compensation and benefi ts ex-
penses, partially offset by reimbursements for research
activities from our collaboration partners. We continue
to be a leader in our industry peer group by reinvest-
ing more than 19 percent of our sales into research and
development. Marketing and administrative expenses
increased 6 percent in 2004, to $4.28 billion, attributable
primarily to increased selling expenses in support of
the new and anticipated product launches, the impact of
foreign exchange rates, increased incentive compensa-
tion and benefi ts expenses, increased charitable contri-
butions to the Lilly Foundation, and increased product
liability expenses, offset partially by ongoing marketing
cost-containment measures and marketing expense
reimbursement from collaboration partners. A majority
of the reimbursements are ongoing.
Net other income for 2004 increased $126.9 million
to $330.0 million. The increase for 2004 was primar-
ily due to income related to the outlicensing of legacy
products outside the United States, milestone payments
from collaborations on the duloxetine molecule, income
related to a previously assigned patent arrangement of
$30.0 million that was recognized in the fi rst quarter of
2004, and other miscellaneous income. This was offset
partially by an increase in the net loss of the Lilly ICOS
LLC joint venture, due primarily to increased market-
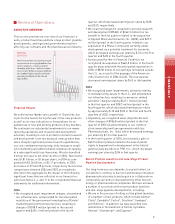
Research and Development
($ millions; percent of net sales)
Research and development expenditures
increased by 15 percent, to $2.7 billion,
in 2004 due to increased clinical trial and
development expenses and increased
incentive compensation and benefits
expenses, partially offset by reimburse-
ments for research activities from our
collaboration partners. At 19 percent of
net sales, we continue to be a leader in
our industry peer group in proportion of
revenue reinvested in research and
development. This significant financial
investment in our pipeline of products
supports our commitment to develop best-
in-class and first-in-class medicines to
provide answers for the unmet medical
needs of our customers.
95 96 97 98 99 00 01 02 03 04
$2,691 19.4%
$2,350 18.7%
$2,149 19.4%
$2,235 19.4%
$2,019 18.6%
$1,784 17.8%
$1,739 18.8%
$1,370 17.2%
$1,190 17.0%
$1.042 16.0%
Gross Margin
(as a percent of total net sales)
Gross margin as a percent of sales decreased by 2.0 per-
centage points to 76.7 percent. This decline was primarily
due to continued investment in our manufacturing
technical capabilities and capacity and the impact of
foreign exchange rates, offset partially by a favorable
product mix due to growth in higher margin products
such as Gemzar, Strattera, Forteo, and the newly launched
Alimta.
00 01 02 03 04
81.1%
81.3%
80.4%
78.7%
76.7%