Eli Lilly 2004 Annual Report Download - page 13
Download and view the complete annual report
Please find page 13 of the 2004 Eli Lilly annual report below. You can navigate through the pages in the report by either clicking on the pages listed below, or by using the keyword search tool below to find specific information within the annual report.-
 1
1 -
2
-
 3
3 -
 4
4 -
 5
5 -
 6
6 -
 7
7 -
 8
8 -
 9
9 -
 10
10 -
 11
11 -
 12
12 -
 13
13 -
 14
14 -
 15
15 -
 16
16 -
 17
17 -
 18
18 -
 19
19 -
 20
20 -
 21
21 -
 22
22 -
 23
23 -
24
-
25
-
26
-
27
-
28
-
29
-
30
-
31
-
32
-
33
-
34
-
35
-
36
-
37
-
38
-
39
-
40
-
41
-
42
-
43
-
44
-
45
-
46
-
47
-
48
-
49
-
50
-
51
-
52
-
53
-
54
-
55
-
56
-
57
-
58
-
59
-
60
-
61
-
62
-
63
-
64
-
65
-
66
-
67
-
68
-
69
-
70
-
71
-
72
-
73
-
74
-
75
-
76
-
77
-
78
-
79
-
80
-
81
-
82
-
83
-
84
-
85
-
86
-
87
-
88
-
89
-
90
-
91
-
92
-
93
-
94
-
95
-
96
-
97
-
98
-
99
-
100
 |
 |

FINANCIALS
11
release of the HHS Task Force Report on Importation,
which concludes that the safety and possible savings of
an importation scheme are questionable.
As a result of the passage of the MMA, aged and dis-
abled patients jointly eligible for Medicare and Medicaid
will receive their prescription drug benefi ts through the
Medicare program, instead of Medicaid, on January 1,
2006. This may relieve some state budget pressures but
is unlikely to result in reduced pricing pressures at the
state level. A majority of states have begun to implement
supplemental rebates and restricted formularies in their
Medicaid programs, and these programs are expected
to continue in the post-MMA environment. Several states
are also attempting to extend discounted Medicaid prices
to non-Medicaid patients. Additionally, notwithstand-
ing the federal law prohibiting drug importation, nine
states have implemented importation schemes for their
citizens, usually involving a website that links patients
to selected Canadian pharmacies. One state has such
a program for its state employees. In the absence of
federal action to curtail state activities, more states are
expected to launch importation efforts. As a result, we
expect pressures on pharmaceutical pricing to continue.
International operations are also generally subject
to extensive price and market regulations, and there
are many proposals for additional cost-containment
measures, including proposals that would directly or
indirectly impose additional price controls or reduce the
value of our intellectual property protection.
OPERATING RESULTS—2004
Sales
Our worldwide sales for 2004 increased 10 percent,
to $13.86 billion, due primarily to the increased global
sales of Strattera, Gemzar, Forteo, Zyprexa, Evista, Hu-
matrope, and Cialis, and sales related to the launches of
Alimta and Cymbalta. Sales in the U.S. increased 6 per-
cent, to $7.67 billion. Sales outside the U.S. increased
15 percent, to $6.19 billion. Worldwide sales refl ected a
volume increase of 5 percent, with global selling prices
contributing 2 percent and an increase due to favorable
changes in exchange rates contributing 3 percent.
Zyprexa, our top-selling product, is a treatment for
schizophrenia, bipolar mania, and bipolar maintenance.
Zyprexa sales in the U.S. decreased 8 percent in 2004
due to a decline in underlying demand from continued
competitive pressures. Zyprexa sales outside the U.S.
increased 22 percent, driven by volume growth in a
number of major markets outside the U.S. International
Zyprexa sales growth also benefi ted from the impact
of foreign exchange rates. Excluding the impact of
exchange rates, sales of Zyprexa outside the U.S. in-
creased by 13 percent in 2004. While we expect Zyprexa
sales in the U.S. to decline in 2005, we believe the ero-
sion will start to slow sometime in 2005. In addition, we
continue to expect double-digit growth of Zyprexa sales
outside the U.S. As a result, we expect a slight decline
in our 2005 worldwide Zyprexa sales.
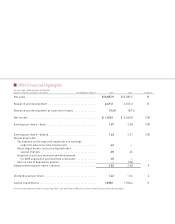
The following table summarizes our net sales activity in 2004:
Year Ended Year Ended Percent
December 31, 2004 December 31, 2003 Change
Product U.S.1 Outside U.S. Total Total from 2003
(Dollars in millions)
Zyprexa . . . . . . . . . . . . . . . . . . . . . . $2,422.2 $1,997.6 $ 4,419.8 $ 4,276.9 3
Gemzar . . . . . . . . . . . . . . . . . . . . . . 565.1 649.3 1,214.4 1,021.7 19
Humalog® . . . . . . . . . . . . . . . . . . . . 685.4 416.2 1,101.6 1,021.3 8
Evista. . . . . . . . . . . . . . . . . . . . . . . . 667.9 344.8 1,012.7 922.1 10
Humulin® . . . . . . . . . . . . . . . . . . . . 422.7 575.0 997.7 1,060.4 (6)
Animal health products. . . . . . . . . 338.9 459.8 798.7 726.6 10
Strattera . . . . . . . . . . . . . . . . . . . . . 656.4 10.3 666.7 370.3 80
Fluoxetine products. . . . . . . . . . . . 327.3 231.7 559.0 645.1 (13)
Anti-infectives . . . . . . . . . . . . . . . . 110.2 367.8 478.0 489.9 (2)
Actos® . . . . . . . . . . . . . . . . . . . . . . . 340.4 112.5 452.9 431.2 5
Humatrope . . . . . . . . . . . . . . . . . . . 204.8 225.5 430.3 370.9 16
ReoPro®. . . . . . . . . . . . . . . . . . . . . . 175.4 187.4 362.8 364.4 0
Forteo . . . . . . . . . . . . . . . . . . . . . . . 198.0 40.6 238.6 65.3 NM
Xigris® . . . . . . . . . . . . . . . . . . . . . . . 123.3 78.5 201.8 160.4 26
Alimta . . . . . . . . . . . . . . . . . . . . . . . 121.8 20.8 142.6 — NM
Cialis2. . . . . . . . . . . . . . . . . . . . . . . . 1.4 129.2 130.6 73.5 78
Cymbalta. . . . . . . . . . . . . . . . . . . . . 92.7 1.2 93.9 — NM
Symbyax . . . . . . . . . . . . . . . . . . . . . 70.1 0.1 70.2 — NM
Other pharmaceutical products. . 144.5 341.1 485.6 582.5 (17)
Total net sales . . . . . . . . . . . . . . $7,668.5 $6,189.4 $13,857.9 $12,582.5 10
NM—Not meaningful
1 U.S. sales include sales in Puerto Rico.
2 Cialis sales shown in the table above represent results in the territories in which we market Cialis exclusively. The remaining sales relate to the joint-
venture territories of Lilly ICOS LLC (North America, excluding Puerto Rico, and Europe). Our share of the joint-venture-territory sales, net of expenses,
is reported in net other income in our consolidated income statement.