Electrolux 2003 Annual Report Download - page 2
Download and view the complete annual report
Please find page 2 of the 2003 Electrolux annual report below. You can navigate through the pages in the report by either clicking on the pages listed below, or by using the keyword search tool below to find specific information within the annual report.-
 1
1 -
 2
2 -
 3
3 -
 4
4 -
 5
5 -
 6
6 -
 7
7 -
 8
8 -
 9
9 -
 10
10 -
 11
11 -
 12
12 -
 13
13 -
14
-
15
-
16
-
17
-
18
-
19
-
20
-
21
-
22
-
23
-
24
-
25
-
26
-
27
-
28
-
29
-
30
-
31
-
32
-
33
-
34
-
35
-
36
-
37
-
38
-
39
-
40
-
41
-
42
-
43
-
44
-
45
-
46
-
47
-
48
-
49
-
50
-
51
-
52
-
53
-
54
-
55
-
56
-
57
-
58
-
59
-
60
-
61
-
62
-
63
-
64
-
65
-
66
-
67
-
68
-
69
-
70
-
71
-
72
-
73
-
74
-
75
-
76
-
77
-
78
-
79
-
80
-
81
-
82
-
83
-
84
-
85
-
86
-
87
-
88
-
89
-
90
-
91
-
92
-
93
-
94
-
95
-
96
-
97
-
98
 |
 |

1%
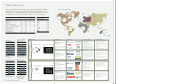
Net sales by geographical area
Latin America 3%
Europe 48%
Africa 1%
Oceania 4%
Net sales in 2003
in the 10 largest countries
SEKm
USA 44,469
Germany 10,777
UK 6,610
France 6,525
Italy 6,027
Australia 4,727
Canada 4,703
Sweden 4,307
Spain 3,306
Brazil 2,575
Total 94,026
This is Electrolux
Net sales and
operating margin*
*Excluding items affecting comparability.
2003 2003
Key data 2003 2002 EUR USD
SEKm, EURm, USDm, unless otherwise stated
Net sales 124,077 133,150 13,590 15,356
Operating income 7,175 7,731 786 888
Margin, % 5.8 5.8
Income after financial items 7,006 7,545 767 867
Net income per share, SEK, EUR, USD 15.25 15.60 1.67 1.89
Dividend per share, SEK, EUR, USD 6.501) 6.00 0.72 0.90
Return on equity, % 17.3 17.2
Return on net assets, % 23.9 22.1
Value creation 3,449 3,461 378 427
Net debt/equity ratio 0.00 0.05
Average number of employees 77,140 81,971
1) Proposed by the Board of Directors.
Consumer Durables
Market position Key brands Performance in 2003 Strategic prioritiesBusiness areas
With sales of SEK 124.1 billion, Electrolux is the world’s largest producer of appliances
and equipment for kitchen, cleaning and outdoor use, such as refrigerators, cookers,
washing machines, chainsaws, lawn mowers and garden tractors. Electrolux is also one
of the largest producers in the world of similar equipment for professional users.
Professional Products
SEKm
140,000
130,000
120,000
110,000
100,000
90,000
%
7.5
6.0
4.5
3.0
1.5
0
Net sales
Operating margin
99 00 01 02 03
Operating income and
return on net assets*
SEKm
10,000
8,000
6,000
4,000
2,000
0
%
25
20
15
10
5
0
Operating income
Return on net assets
99 00 01 02 03
Net income and
dividend per share*
Net Income
SEK
20
16
12
8
4
0
Dividend
SEK
7.5
6.0
4.5
3.0
1.5
0
Net income per share
Dividend per share
1) Dividend proposed by
the Board of Directors.
99 00 01 02 031)
Income after financial
items and return on
equity*
SEKm
10,000
8,000
6,000
4,000
2,000
0
%
25
20
15
10
5
0
Income after financial items
Return on equity
99 00 01 02 03
01 02 03
Net sales Operating margin
North America 40%
Asia 4%
SEKm
125,000
100,000
75,000
50,000
25,000
0
%
7.5
6.0
4.5
3.0
1.5
0
Net sales and operating margin
Share of total Group sales
Europe
39%
North
America 36%
Rest
of the
world
10%
• Strong sales growth and higher
income in USD for appliances in
North America
• Continued positive trend for
sales volume and income within
appliances in Europe
• Continued negative income for
appliances outside Europe and
North America, but improvement
in fourth quarter
• Strong sales growth and higher
income in USD for consumer out-
door products in North America
• Weaker demand and somewhat
lower sales in Europe, improved
operating income
• Continued weak market
conditions in food-service
equipment and laundry
systems
• Overall lower income,
unchanged margin
• Divestment of compressor
operation
• Increased demand for chainsaws
and garden equipment, decline
for diamond tools
• Increased income, margin
remained at high level
• Increase investments in product
development and the Electrolux
brand
• Relocate production facilities, e.g,
new plants in Eastern Europe, Asia
and Mexico
• Increase purchases from low-cost
countries
• Launch new high-end products in
US under Electrolux brand
• Leverage synergies with Professional
Outdoor Products
• Create Electrolux-branded product
offering
• Roll-out up-market product range
under Husqvarna brand in US
• Focus on core areas within food
service and laundry systems
• Establish sales organization for
food service in US
• Launch new product concepts
• Maintain profitable position within
chainsaws
• Continue to grow commercial lawn
and garden business
• Improve cost structure within
diamond tools
Indoor products
White goods: Market leader in
Europe and Australia, third largest
producer in US
Floor-care products: World leader,
largest producer in Europe, second
largest in US
Outdoor products
World’s largest producer of garden
tractors, lawn mowers and other
portable petrol-driven garden
equipment
Outdoor products
Chainsaws: World’s largest
producer
Diamond tools: One of the world’s
largest producers of diamond
tools and related equipment for
the construction and stone
industries
Indoor products
Food-service equipment: Market
leader in Europe, third largest
producer in the world
Laundry equipment: One of the
world’s leading producers
Share of total Group sales
Indoor
products
6%
Outdoor
products 9%
01 02 03
Net sales Operating margin
SEKm
30,000
24,000
18,000
12,000
6,000
0
%
12.5
10.0
7.5
5.0
2.5
0
Net sales and operating margin